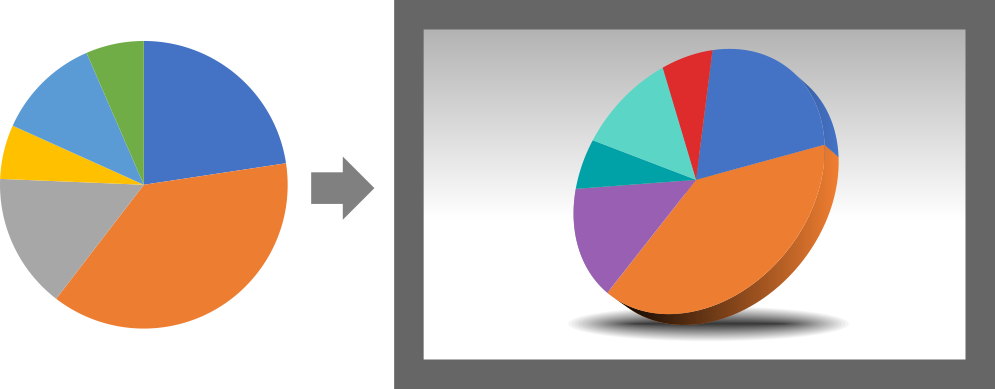
I have never made graphs before in Illustrator, but I have an incoming project where I will have to make a variety of different graphs based on large quantities of numerical data that I will be given. I want to be able to set up the style of the graphs in Illustrator, and then use the data to fill in the specific values.
A few weeks back I stumbled upon this thread regarding making a circular graph by coding it in an EPS file. This seems really intriguing to me, but I'm not familiar with EPS nor how to set up shapes/graphs in an EPS. Additionally, I'm not sure if learning to make graphs in EPS is worth my time, or if I should try to set up my graphs in some other way.


