1

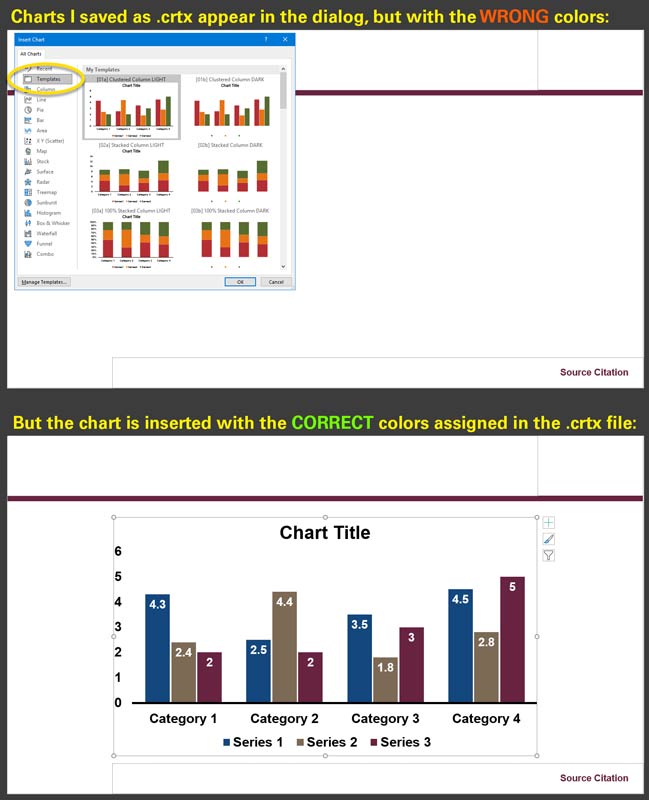
I've created a series of .crtx files to insert pre-formatted charts in PowerPoint. They work fine, however, in the Insert Charts dialog, the options under "Templates" display charts with the wrong color palette from what I designed. Despite this, the chart's colors appear correctly when inserted. I want the choices in the dialog to appear consistent with what's inserted on the slide and what I've designed in the .crtx files. Strangely, once one of my custom .crtx charts is on a slide, the Change Chart Type dialog (Chart Tools Tab | Design Tab) displays the correct colors, as intended under "Templates."

I'd love to know if there's a solution to this. Thanks!

chart template choices appear differently from what is inserted

2
  • It is very unlikely that you will find an answer for this here. Graphic designers just dont use office tools much. Even if they did its a bit outside expertise.
    – joojaa
    Commented Jul 24, 2019 at 8:43
  • I thought this forum would be more appropriate than StackOverflow. I also Tweeted my predicament directly to Microsoft...crickets.
    – itsmikem
    Commented Jul 24, 2019 at 15:22

2 Answers 2

2
+25

The colors in the dialogue are the base colors that PowerPoint works with. It doesn't seem like the colors in the preview can be changed.

I just tried it with my version of PowerPoint and the same thing happened. The preview is in the "PowerPoint" colors but when I bring it into my presentation the colors are changed to how I changed them.

5
  • It may be more flexible to change your colors in your template too then you can use same template with document colors. And now you can have different flavours of graphs.
    – joojaa
    Commented Jul 23, 2019 at 12:20
  • Thanks for answering Chris. "It doesn't seem..." For my hard earned bounty, I'd like a more concrete answer than "seems." Have you spotted any documentation for that?
    – itsmikem
    Commented Jul 23, 2019 at 16:47
  • Thanks joojaa. I do have a custom color set in my template. I just want to have the menu reflect what will be inserted on the slides.
    – itsmikem
    Commented Jul 23, 2019 at 16:48
  • 1
    @itsmikem No, sadly I couldn't find any documentation on it. I just saw this question, tried it out a couple of times and the colors always stayed the same. I thought at first that they just used the graph that the altered graph was based on as the preview image, but when I removed or altered the data, that was changed in the preview. So it would make sense that you could change the color, but the options for saving templates is very lacking. Don't worry about the bounty, maybe someone will still arrive who knows PowerPoint better than I do and can give you a better answer.
    – Chris
    Commented Jul 24, 2019 at 6:09
  • Thanks very much Chris. I really appreciate your responses.
    – itsmikem
    Commented Jul 24, 2019 at 15:25
0

Through my employer, I was able to elevate the issue to Microsoft directly, and they have implemented a bug fix for this. Problem solved.

Your Answer

By clicking “Post Your Answer”, you agree to our terms of service and acknowledge you have read our privacy policy.

Not the answer you're looking for? Browse other questions tagged or ask your own question.