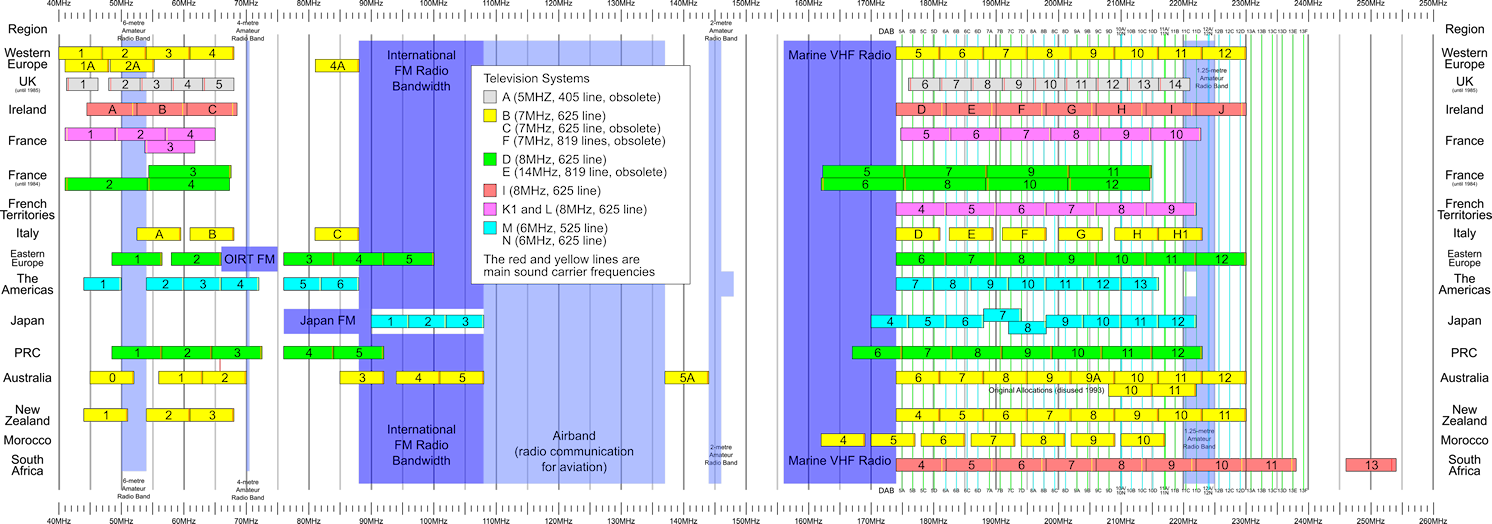
I would like to replicate this graph for the allocation of radio bands frequency, using a different set of data but a similar style. I would like to avoid making it from scratch and I was looking for some software that could help me making one, but I don't even know how to describe such a type of graph
https://en.wikipedia.org/wiki/Very_high_frequency#/media/File:VHF_Usage.svg (it doesn't let me add the image directly, maybe it cannot show SVGs?)

