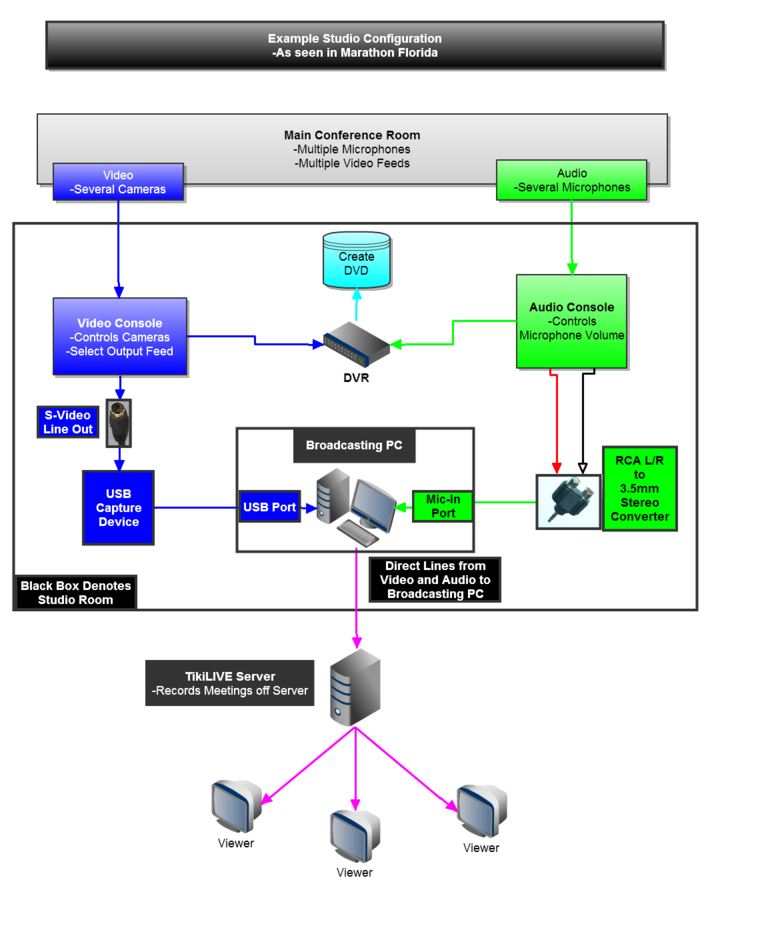
Is there any software, preferably free, preferably supporting drag & drop, preferably supporting save & load to ease the creation diagrams like these?


(source: tikilive.org)
Is there any software, preferably free, preferably supporting drag & drop, preferably supporting save & load to ease the creation diagrams like these?


(source: tikilive.org)
I would use yEd* not only does this tool draw these it also makes automatic layouts for your nodes. Other software would include MS Visio.

Image 1: A image made with yEd illustrator combo (yEd made preliminary layout)
Another approach would be to use Graphviz, which could make your graphs 100% without your input from a data source easily.
* yEd is free and can be run over web with java if needed.
I will probably get booed for saying this, but MS PowerPoint is actually good at this kind of diagrams.
The reason I suggest it is because a lot of people have it already installed in their systems, so you would not need to install anything else.
Power Point offers, basically, a subset of vector editing features (such as Adobe Illustrator's) with snapping features.
In relation with this kind of diagrams in particular, it allows you to create "text containers" with different shapes (diamonds, rectangles, circles, ...) and use different kinds of "connectors" to connect them. The connectors snap to the shapes and stay stuck to them so you can re-position the text containers without loosing their connections. The connectors themselves can have different styles (arrows, straight lines, ...) and have "control points" that allow you to redirect their path, in case you don't like the default one.
It allows you, of course, to change colours, fonts, etc... It also allows you to export to JPG as one of the options, which is what you mentioned you need.
I think MS Word probably allows you to do the same thing using their "drawing canvas"feature, but I am not sure about that.
Draw.io is a great online tool you can use to create images like this. It also syncs directly with drive/dropbox and other cloud services.
Those are called "Syntax Diagrams" or some such thing, they are related to BNF form for specifying syntax. There's a book by "Tobias" you can find by Googling that name and "basics of compiler design" that talks you through those digrams.
Pascal made them popular. They can also be found to document SQL (if you look at SQLite's documentation)
To draw them I recommend "graphviz" I am shocked it hasn't been specified already. You take a file (usually ending in ".dot") and run something like:
dot mygraph.dot -Tpng > mygraph.png
Job done, it draws many kinds of graph and there are lots of things to tune. I use that for loads of things.
Most recently I used it to debug an error-recovering parser, this was a large tree and it aranged it superbly.
Addendum
I did a search quickly for doing these in Graphviz and I came across the name "Railroad diagram" and then altered my search and found:
https://stackoverflow.com/questions/773371/what-is-a-good-tool-for-creating-railroad-diagrams
That asks how SQLite did them and has some solutions - I did mention I've seen this diagram with SQLite and that's how they did it.
An interesting online tool is https://cacoo.com/ as the trhend with this kind of tools, a free plan and some monthly fees. The interesting part is that is colaborative.
Inkscape https://inkscape.org/ also have some conector tools.
One not free, but verey friendly for this kind of drawings is Draw plus http://www.serif.com/drawplus/ There is a free version but the conector tool is disabled.
Corel Draw also have some conector tools for that.