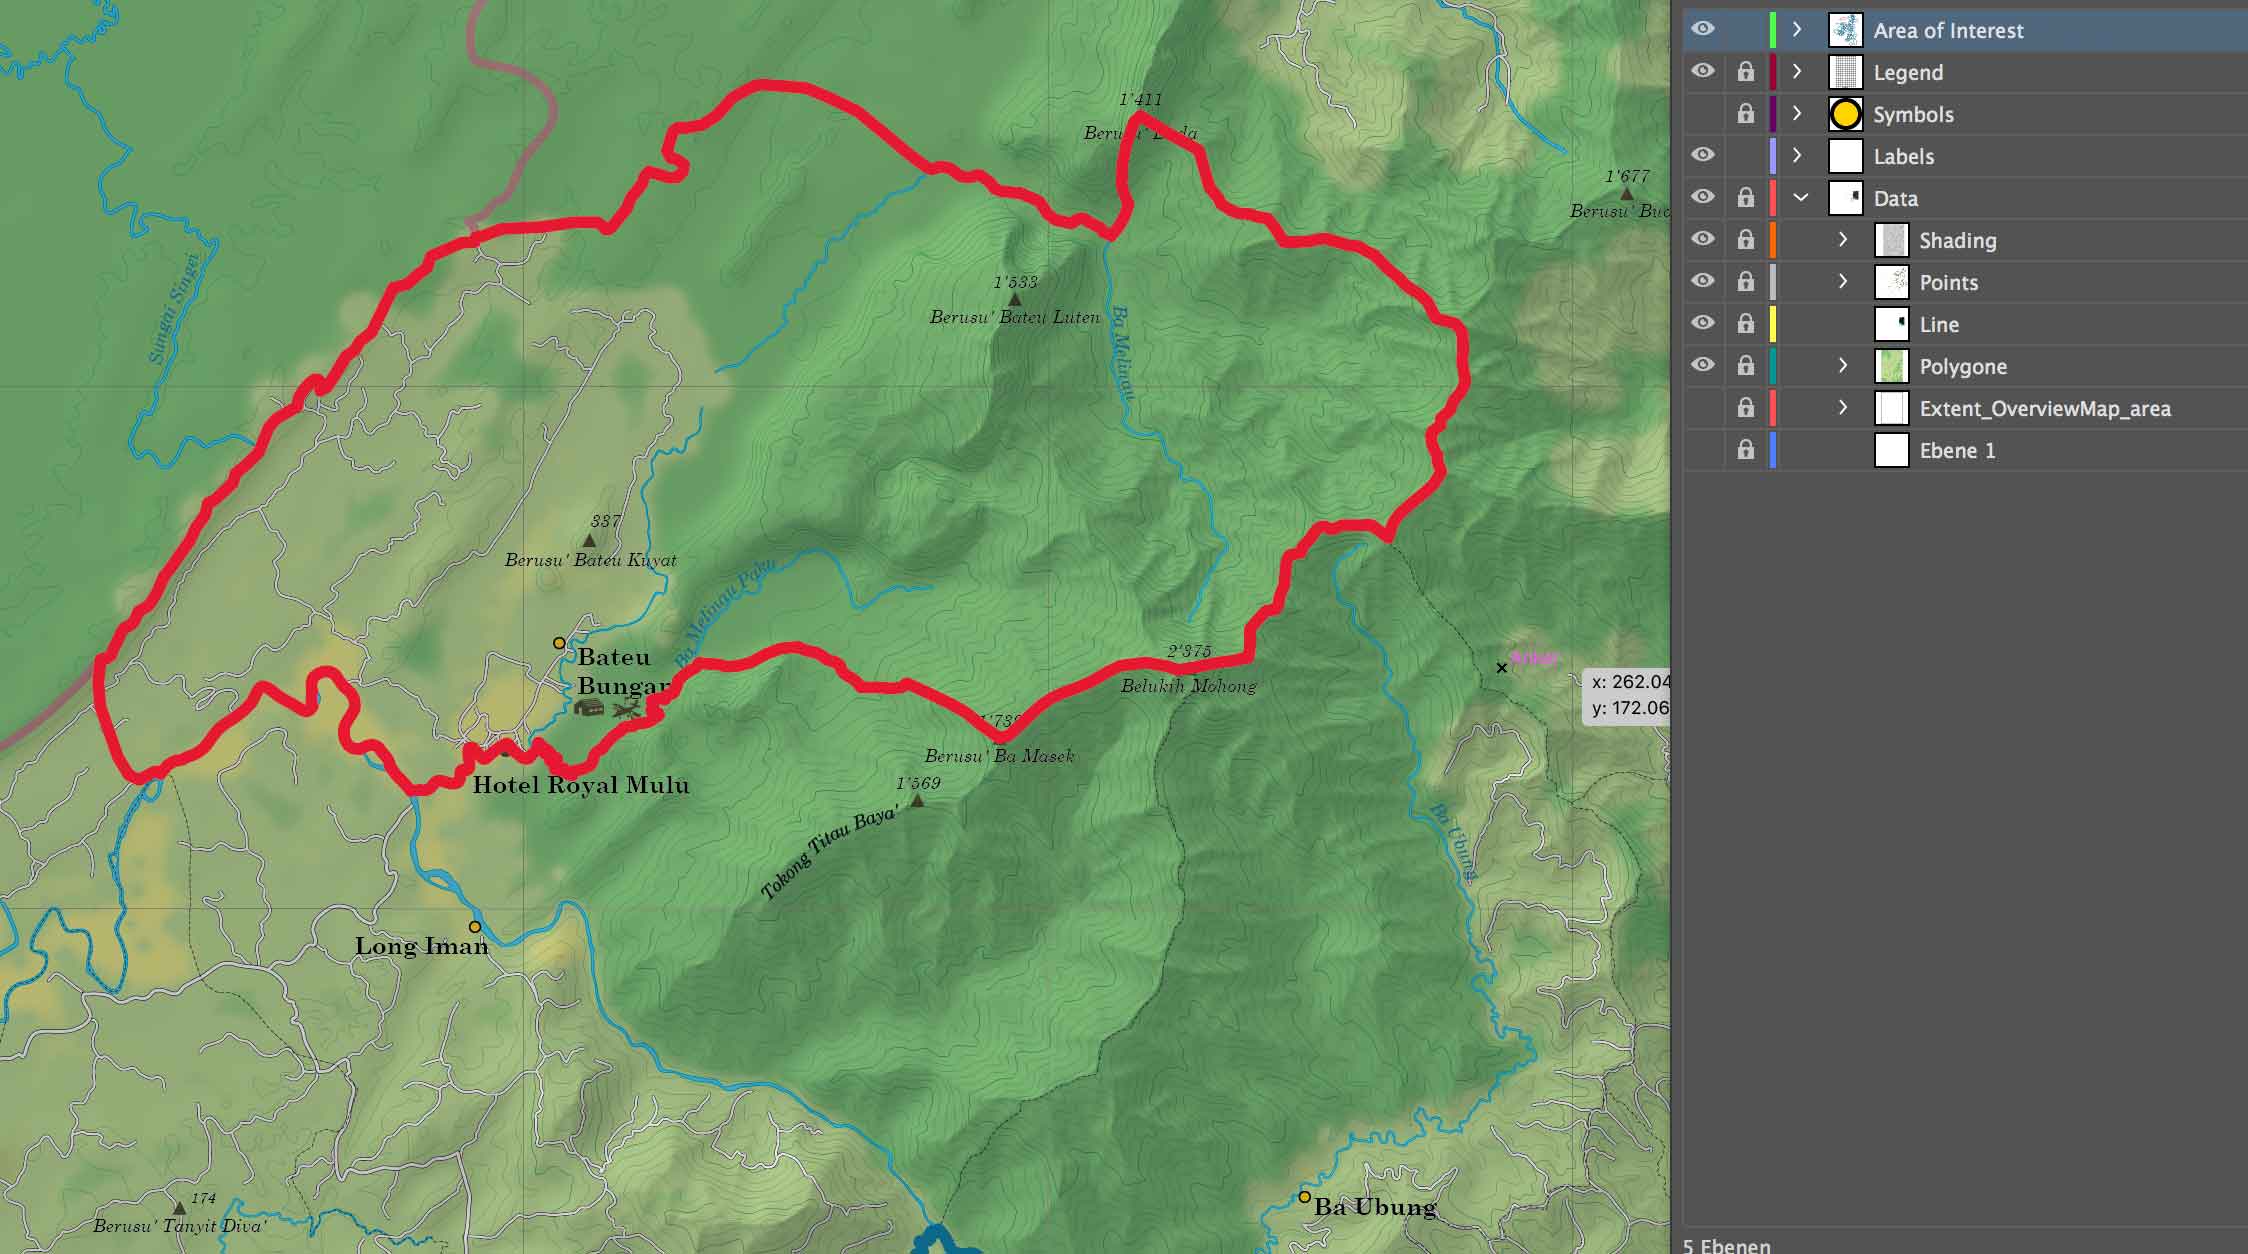
I am working with Adobe Illustrator and the Avenza Mapublisher plugins which allows to load geodata into Illustrator. I create topographical maps consisting of mostly vector data and a shading in png format. An example of my layer structure in the image below on the rightern side.
My problem: I am trying to find a method to highlight the data inside my area of interest in red. One example might be that everything outside is in black and white or another example everything outside is less saturated, e.g. by applying a masked effect on an area.
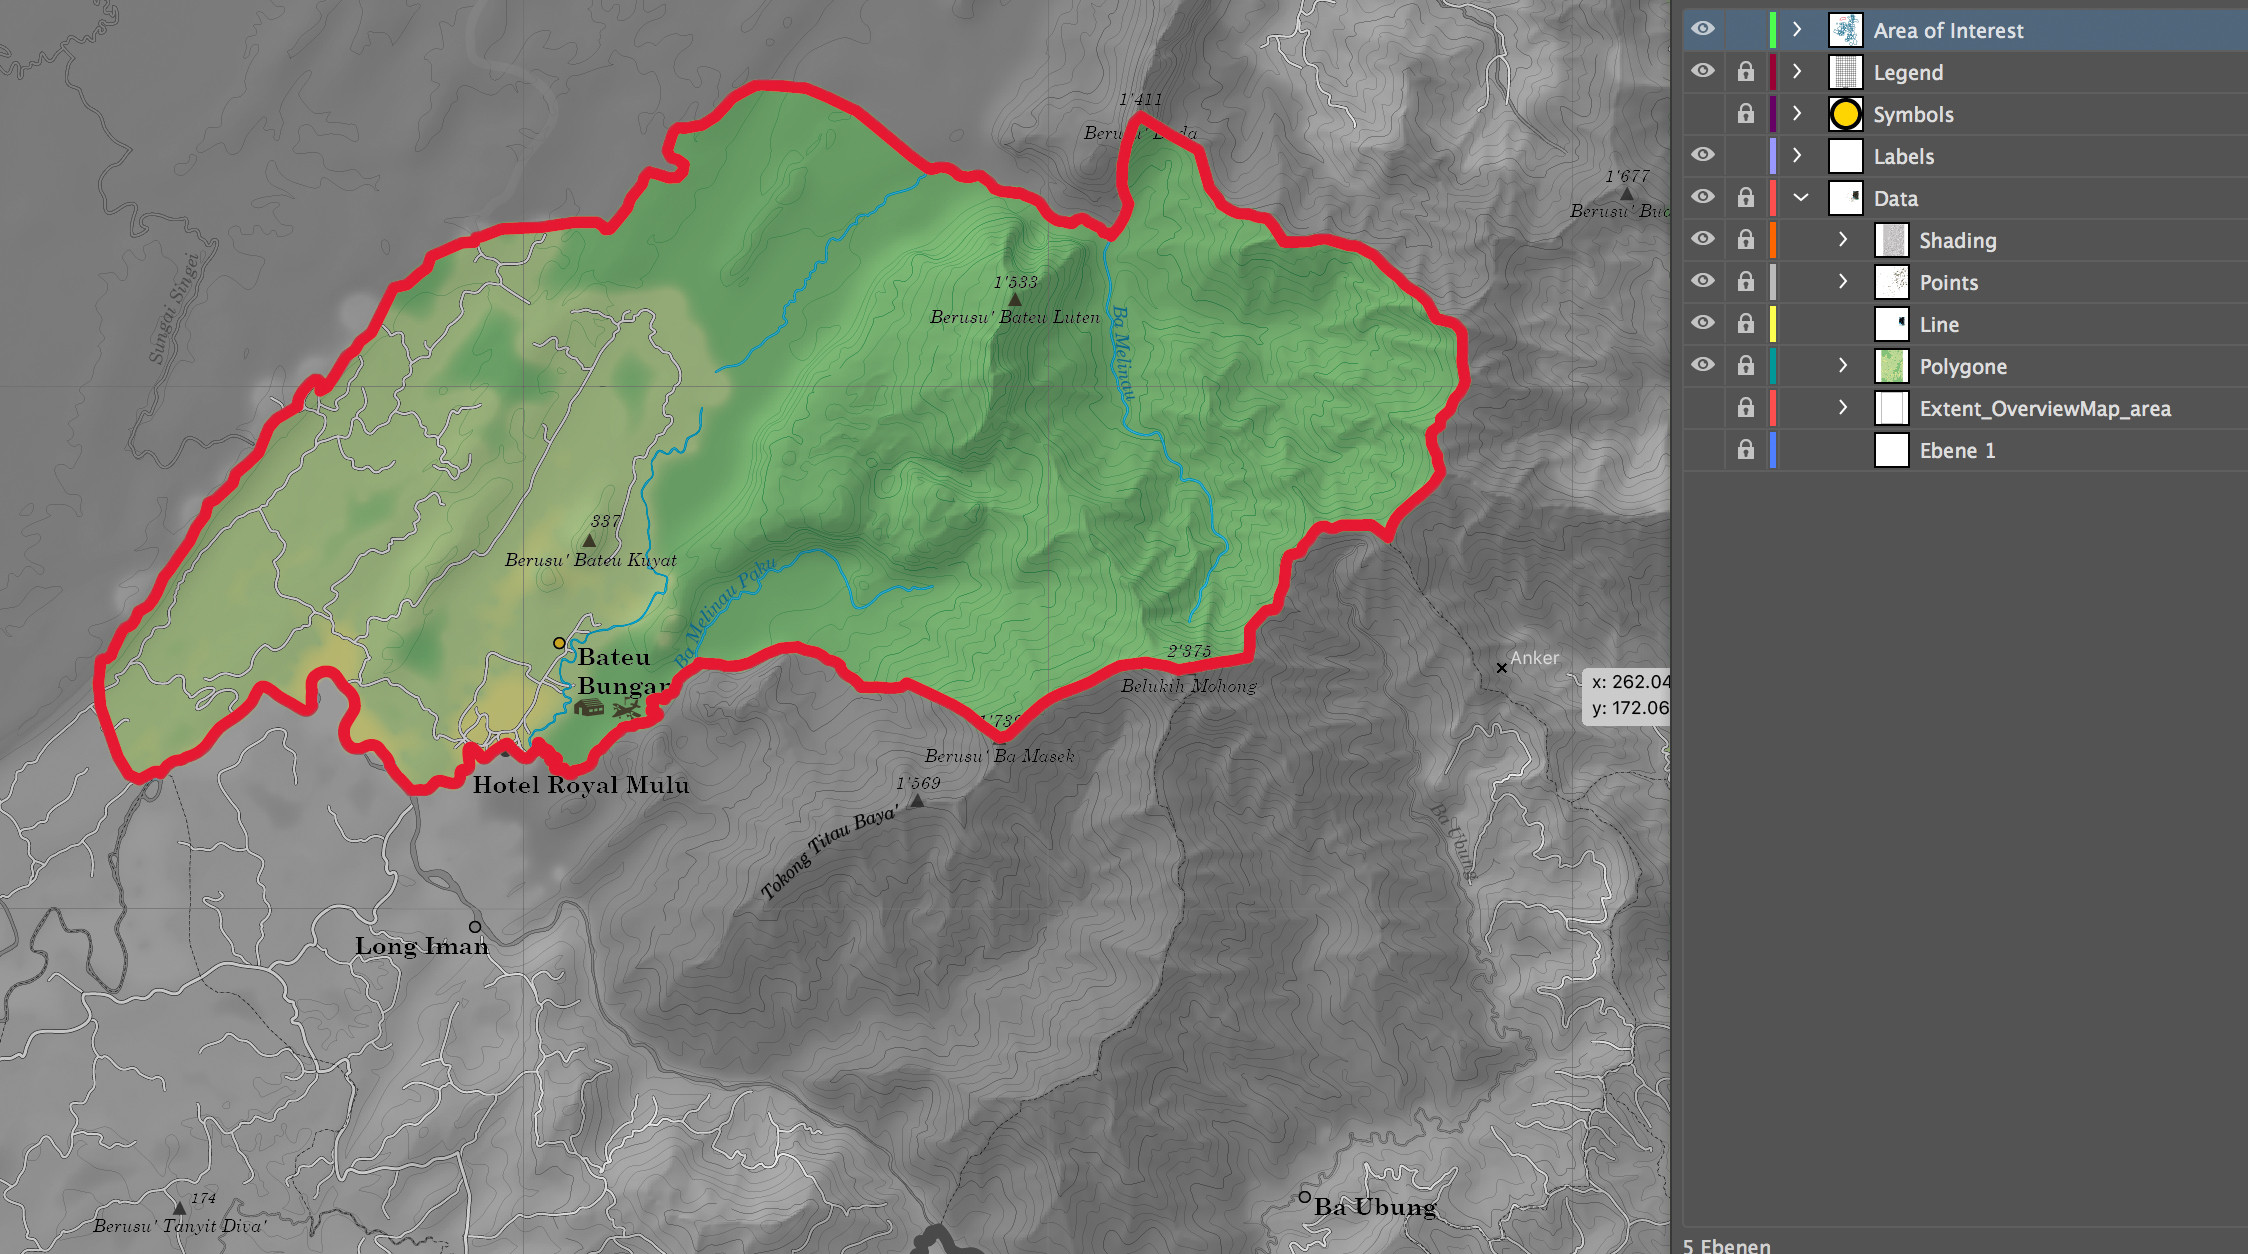
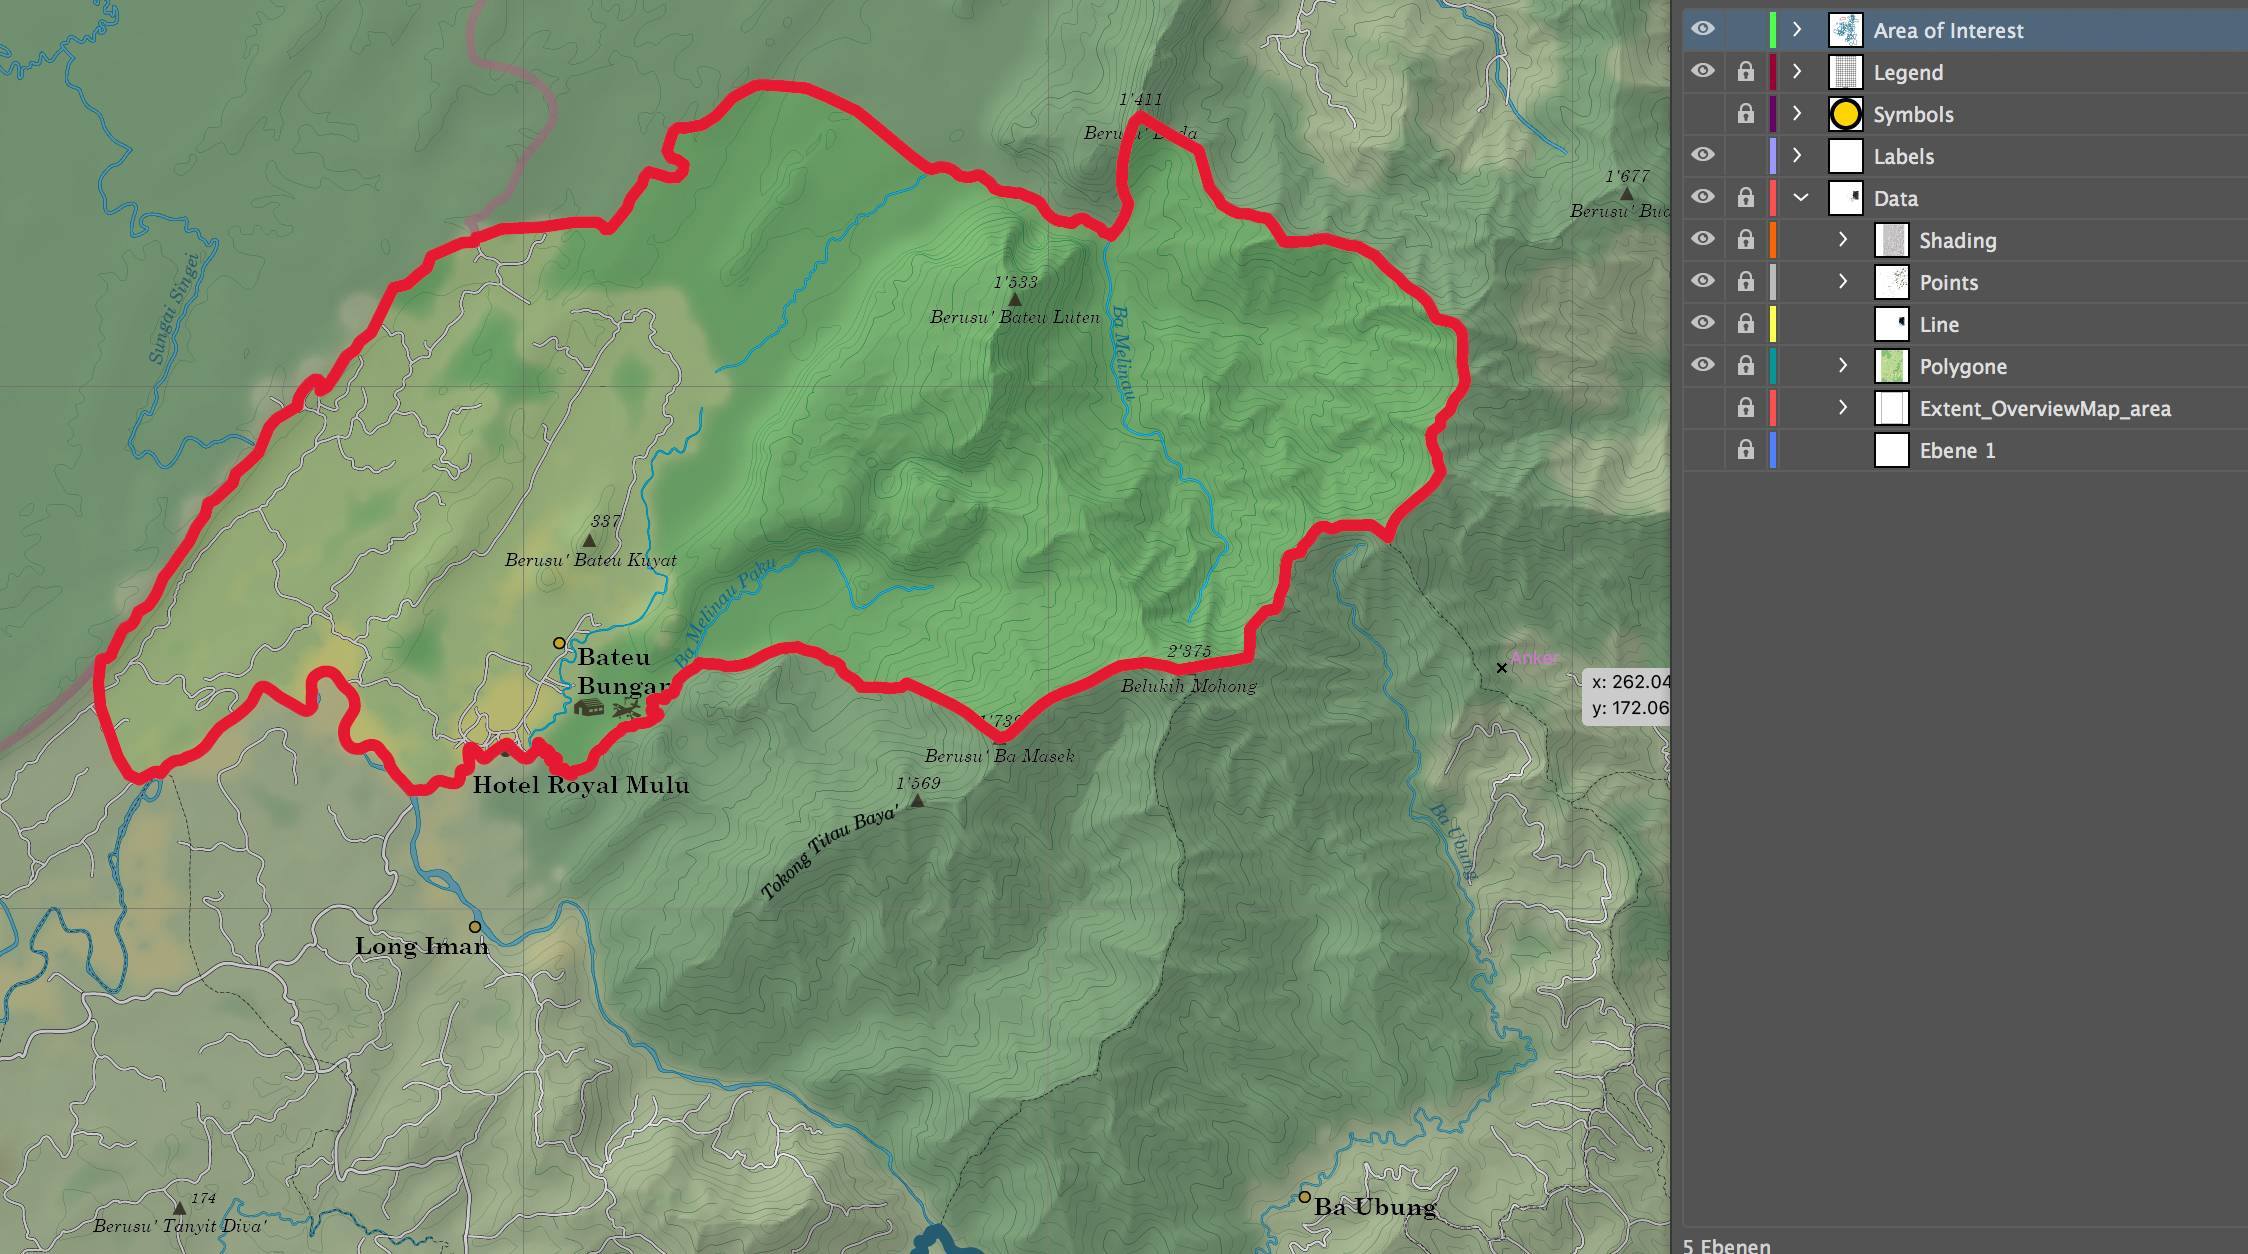
I can do this in Photoshop (see illustration below) but I was wondering if anyone has an idea of how to solve this in Illustrator with grouped data. I tried to create a clipping mask by moving 'Area of Interest' into the layer 'Data' but this did not work properly as the geodata is grouped and consists of multiple paths.
Attached below the examples of the effect I am trying to achieve (edited in Photoshop) for illustration. Any ideas how I could solve this are highly appreciated.


