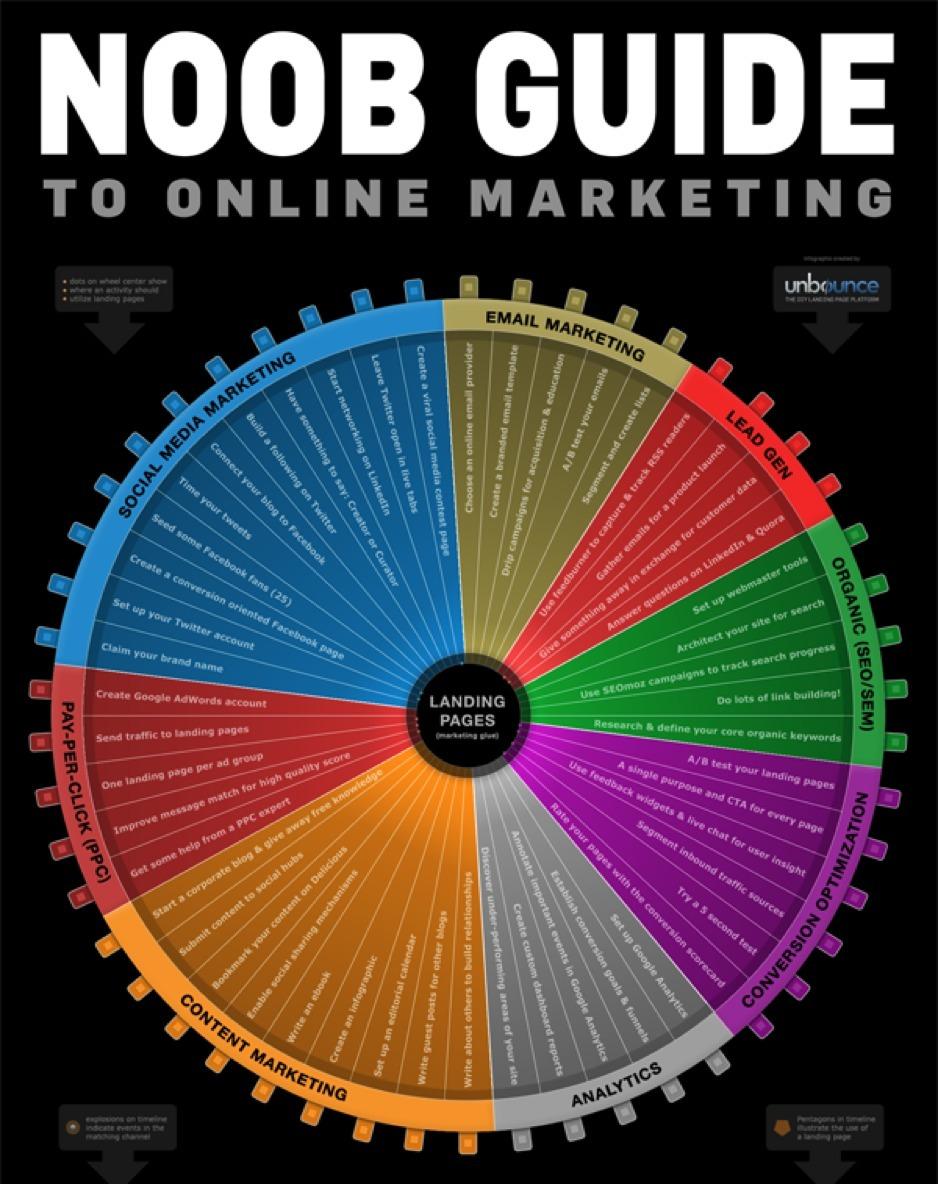
There is a concept known as using the 'wrong tool for the job'. Thing is the wrong tool is either illustrator or you.
Creating info-graphics is one of those things where either you learn programming or use a tool designed for your task. Now since you want to design stuff that is unique odds are you need to learn programming. Thing is though the kind of programming you need for most info graphics is the simplest of simple programming since your looping over data.*
Now in fact doing this without programming is not a big task (5-10 mins total). Ill outline a good strategy. Calculate the slice width (360/number of slices), write one text. Rotate a copy of that text with rotate tools numeric input (dont group 2 text it makes combining the threading harder). Hit control+d until you have the circle. link the texts together and paste your text (where each item was a row). Now, the benefit of this strategy is that you can change the text and order of the text later, but not number of rows.
This creates a template that has some flexibility. Which allows you to change things later. This is important, with data of any kind, you do not want to be constrained by the data being done before you start designing!
A better way? Either use a software designed for data viuslisation. And NO excel is not a good tool for this, forget excel it is constraining your ideas. Learn to use something like Mathematica, ScipPy (use jupyter notebooks) or learn illustrator scripting.
Ok so you have illustrator. Whet you are describing is a loop. A loop is a instruction that repeats itself. Here is how making this looks like:
#target illustrator

// A placeholder for data
data = [
"Dulcie Stancill",
"Florrie Holsinger",
"Petrina Coates",
"Mei Clemens",
"Elicia Good",
"Ron Levy",
"Reanna Brueggemann",
"Aleen Villalobos",
"Giselle Phares",
"Boyce Zahn",
"Demetrice Raposa",
"Signe Dantzler",
"Gracia Becton",
"Michale Wilton",
"Zona Pushard",
"Latonya Morejon",
"Laure Weinmann",
"Laurene Ohara",
"Nathanial Mcelvain",
"Brock Mcandrew"
];


for(var i = 0; i < data.length; i++){

   text = activeDocument.textFrames.add();
   text.contents = "\t"+data[i];
   text.rotate(i*360/data.length, true, true, true, true, Transformation.DOCUMENTORIGIN);

}
Long huh? Well not so long. realistically its just 3 commands and your data, but you can change your data section and boom its redone. I also added a tab in front of the text so now you can use tabstops and styles to change the size of the circle.
* Contrary to common knowledge programming is EASY. It is just that most people jump to programming when their problem is too complex. They should start when its easy. As a result they always get a feeling that its hard, due to their actions. Hard things are hard after all no matter whether the tool you sue is easy or not.
On the other hand being a programmer is hard since nobody pays for programming easy things.


