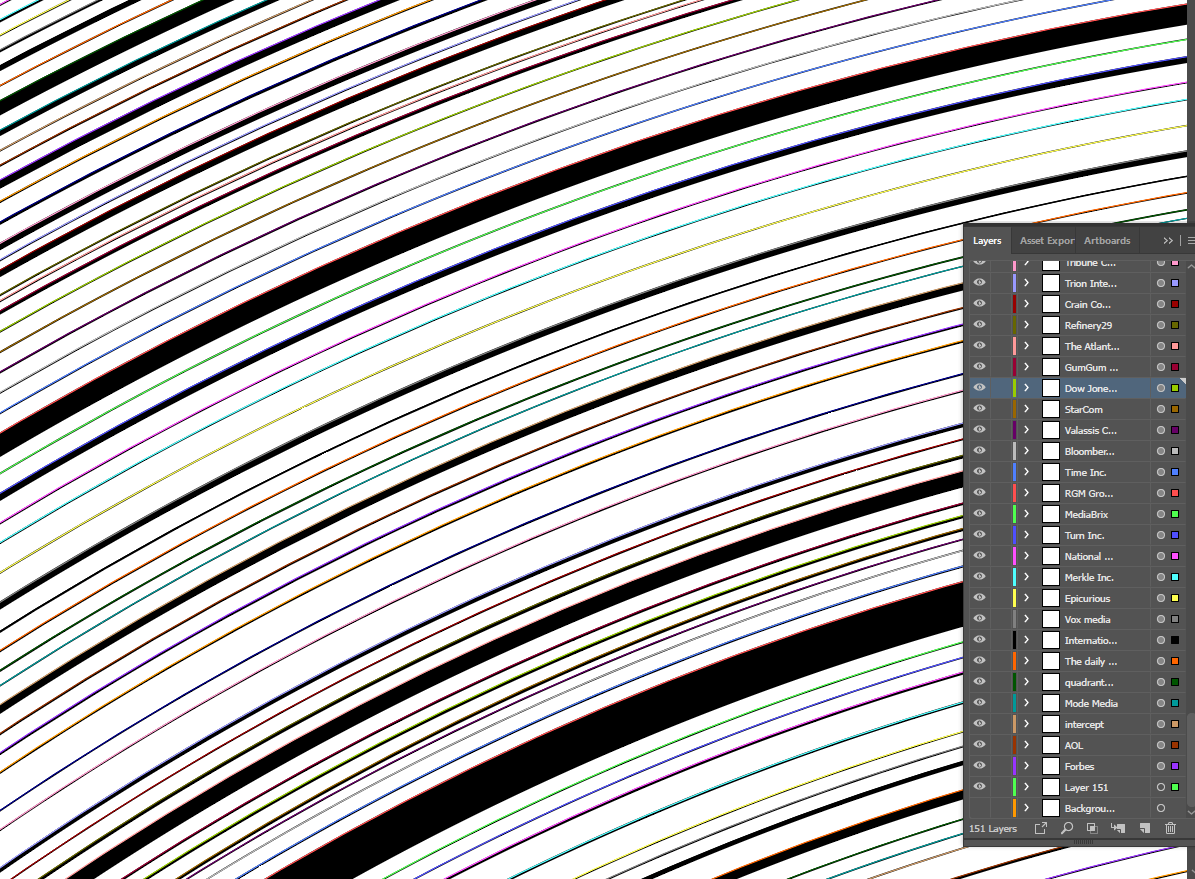
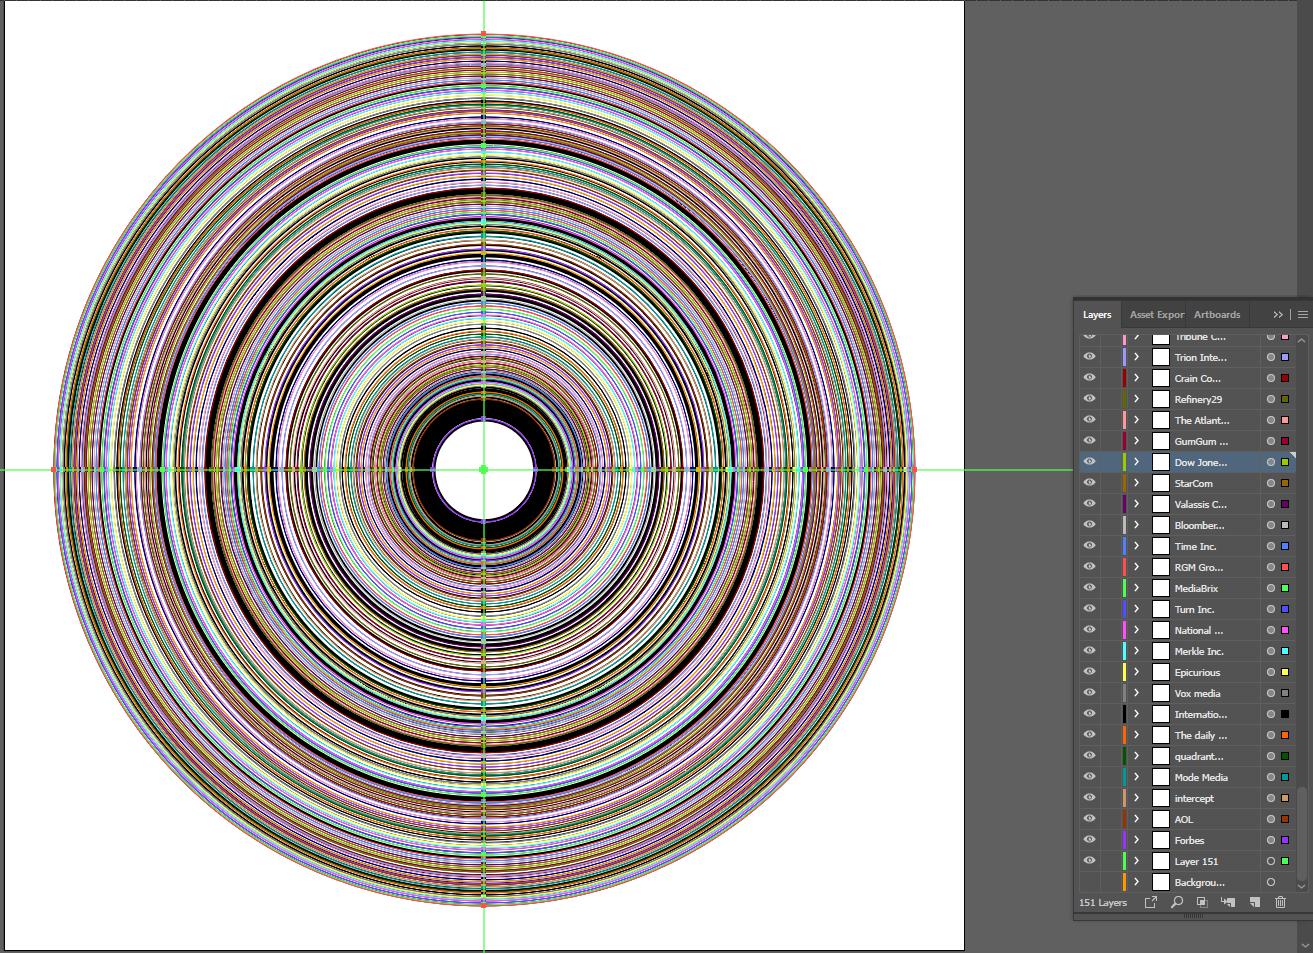
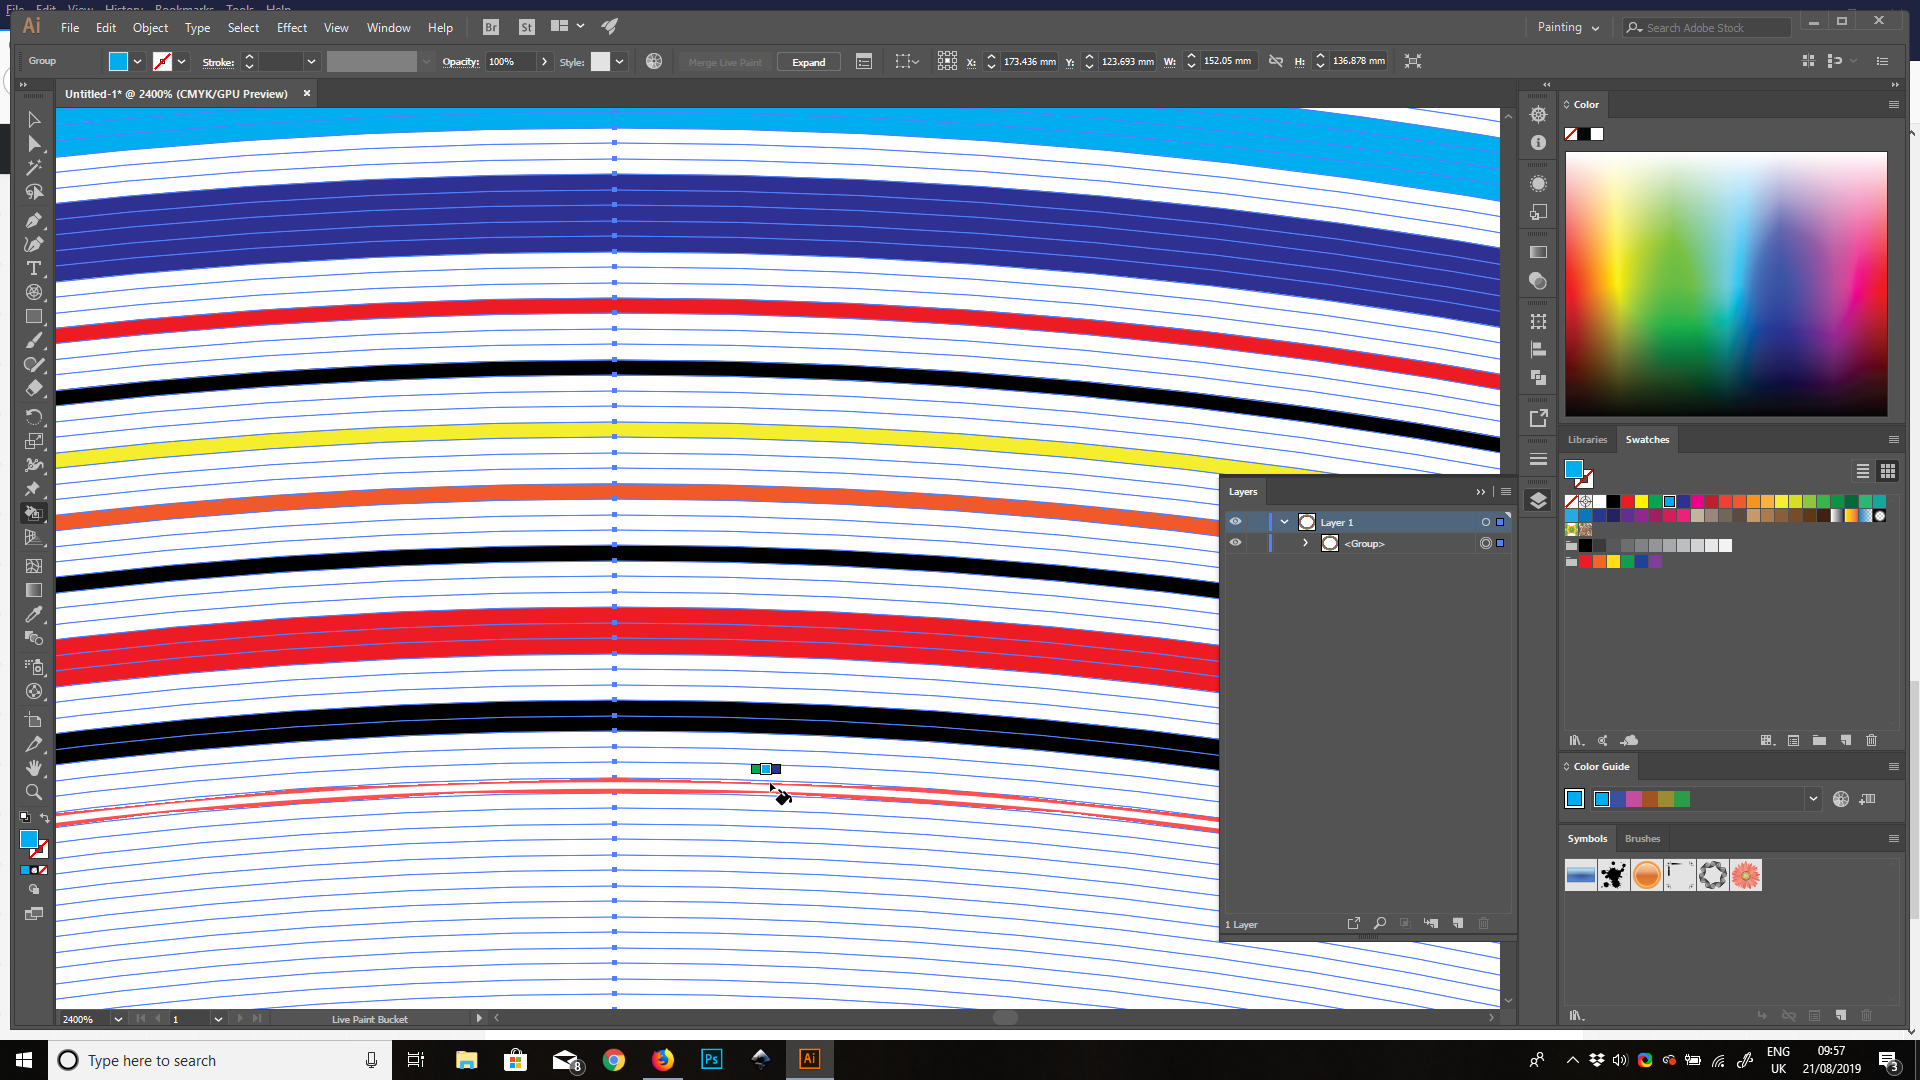
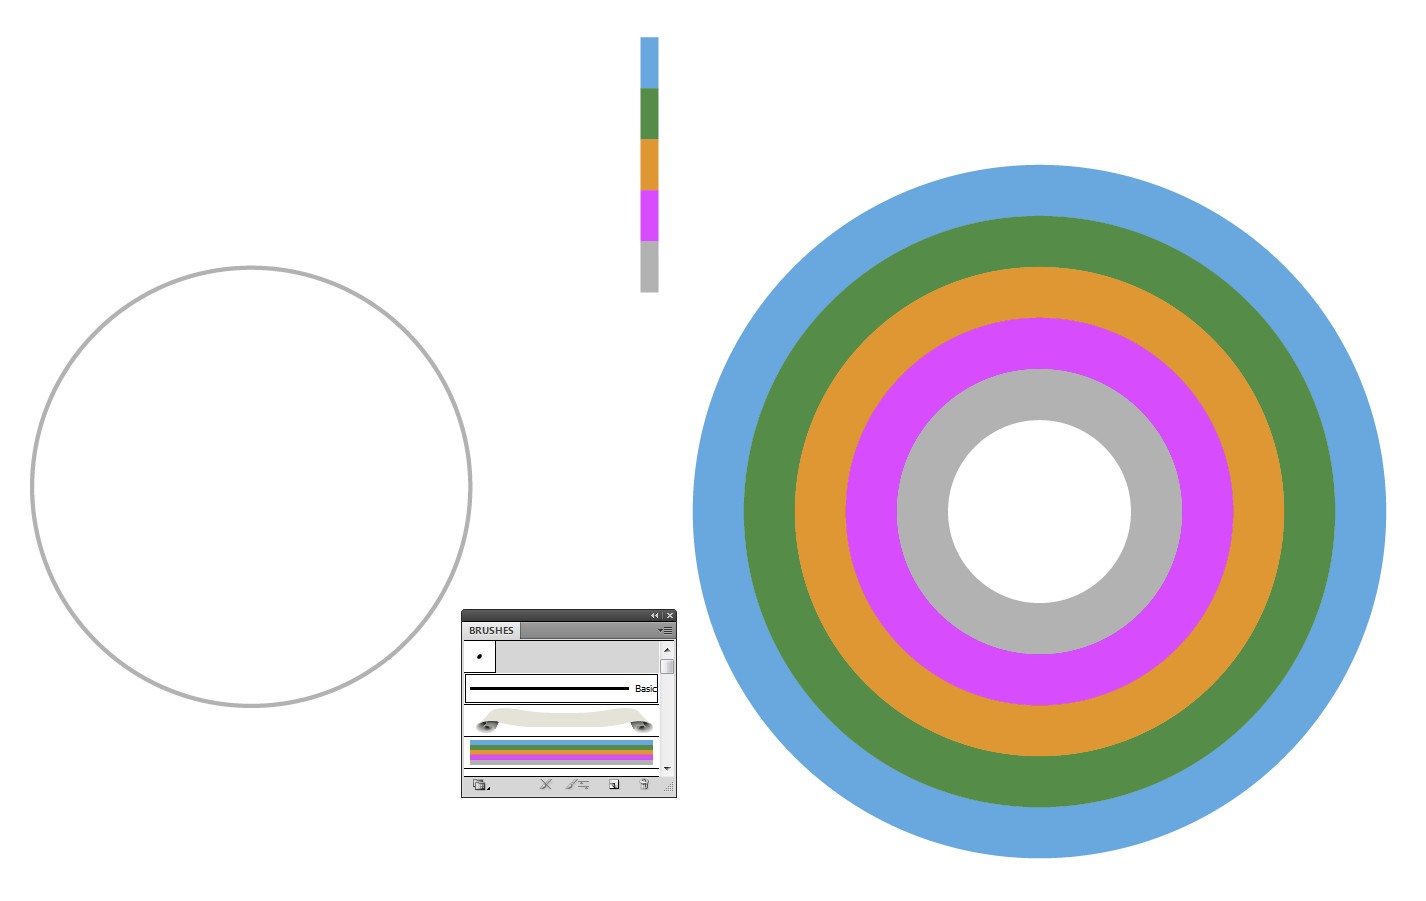
I'd say things like this are better done with automation. Imagine width of one of the items in the middle of your collection changes and you'll have to rebuild half of the circles. Or you need to make all the circles 50% more wide. Oh man!
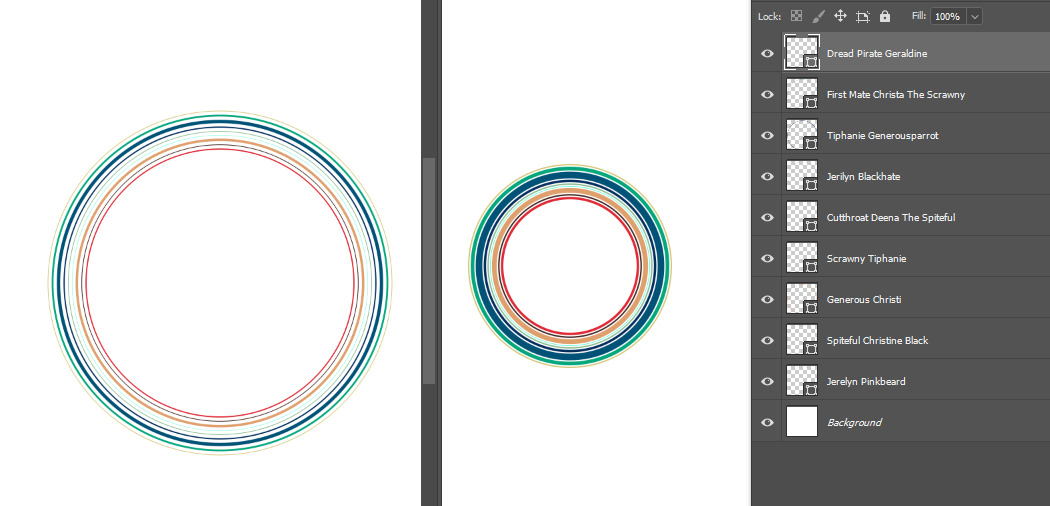
I don't know Illustrator scripting, but in Photoshop it's quite straightforward. Basically I have a data array with properties like name, value, color and I have a function that creates a shape layer in specific coordinates with a specific radius. Plus I have several additional parameters like a gap between the circles, a maximum width of a circle and a starting radius.
Using this data, in a loop I create a circle for each data entry. Center is always a document center, width is calculated linearly based on a maximum width and a maximum data value found, radius is calculated based on a width, previous radius and a gap.
Here're different results based on different settings for a gap, starting radius and max width:
And the code I used:
function main()
{

    //data definitions
    var center = {
        x: activeDocument.width.as("px") / 2,
        y: activeDocument.height.as("px") / 2
    };
    var gap = 3; // gap between circles
    var startRad = 200; // starting radius
    var maxWidth = 15; // maximum width
    var maxValue = -1; // stores maximum value found
    var width, i;

    var data = [
    {
        color: [223,41,53],
        value: 22,
        name: "Jerelyn Pinkbeard"
    },
    {
        color: [65,39,34],
        value: 13,
        name: "Spiteful Christine Black"
    },
    {
        color: [223,160,110],
        value: 44,
        name: "Generous Christi"
    },
    {
        color: [12,243,187],
        value: 4,
        name: "Scrawny Tiphanie"
    },
    {
        color: [134,186,144],
        value: 12,
        name: "Cutthroat Deena The Spiteful"
    },
    {
        color: [5,47,95],
        value: 22,
        name: "Jerilyn Blackhate"
    },
    {
        color: [0,83,119],
        value: 60,
        name: "Tiphanie Generousparrot"
    },
    {
        color: [6,167,125],
        value: 33,
        name: "First Mate Christa The Scrawny"
    },
    {
        color: [213,198,122],
        value: 12,
        name: "Dread Pirate Geraldine"
    }];

    /////////////////////////////////////////////////////////////////////////////////////
    // START

    // first calculating maximum value of all data properties to use it later for linear transforms
    for (i = 0; i < data.length; i++)
    {
        if (data[i].value > maxValue) maxValue = data[i].value;
    }

    // creating circles
    for (i = 0; i < data.length; i++)
    {
        //calculating width lineary based on maximum value found and maximum width possible
        width = linear(data[i].value, 0, maxValue, 0, maxWidth);

        createCircle(
        {
            x: center.x, // X center of the document
            y: center.y, // Y center of the document
            color: data[i].color, // color from my data
            width: width, // calculated width
            radius: startRad, // starting radius
            name: data[i].name // and a name
        });

        startRad += width + gap; // updating starting radius with width and gap
    }

    function createCircle(data)
    {
        var desc2 = new ActionDescriptor();
        var ref1 = new ActionReference();
        ref1.putClass(sTID('contentLayer'));
        desc2.putReference(cTID('null'), ref1);
        var desc3 = new ActionDescriptor();
        var desc4 = new ActionDescriptor();
        var desc5 = new ActionDescriptor();
        desc5.putDouble(cTID('Rd  '), 45.000001);
        desc5.putDouble(cTID('Grn '), 77.000003);
        desc5.putDouble(cTID('Bl  '), 113.000001);
        desc4.putObject(cTID('Clr '), cTID('RGBC'), desc5);
        desc3.putObject(cTID('Type'), sTID('solidColorLayer'), desc4);
        var desc6 = new ActionDescriptor();
        desc6.putInteger(sTID('unitValueQuadVersion'), 1);
        desc6.putUnitDouble(cTID('Top '), cTID('#Pxl'), data.y - data.radius);
        desc6.putUnitDouble(cTID('Left'), cTID('#Pxl'), data.x - data.radius);
        desc6.putUnitDouble(cTID('Btom'), cTID('#Pxl'), data.y + data.radius);
        desc6.putUnitDouble(cTID('Rght'), cTID('#Pxl'), data.x + data.radius);
        desc3.putObject(cTID('Shp '), cTID('Elps'), desc6);
        var desc7 = new ActionDescriptor();
        desc7.putInteger(sTID('strokeStyleVersion'), 2);
        desc7.putBoolean(sTID('strokeEnabled'), true);
        desc7.putBoolean(sTID('fillEnabled'), false);
        desc7.putUnitDouble(sTID('strokeStyleLineWidth'), cTID('#Pxl'), data.width);
        desc7.putUnitDouble(sTID('strokeStyleLineDashOffset'), cTID('#Pnt'), 0.000000);
        desc7.putDouble(sTID('strokeStyleMiterLimit'), 100.000000);
        desc7.putEnumerated(sTID('strokeStyleLineCapType'), sTID('strokeStyleLineCapType'), sTID('strokeStyleButtCap'));
        desc7.putEnumerated(sTID('strokeStyleLineJoinType'), sTID('strokeStyleLineJoinType'), sTID('strokeStyleMiterJoin'));
        desc7.putEnumerated(sTID('strokeStyleLineAlignment'), sTID('strokeStyleLineAlignment'), sTID('strokeStyleAlignOutside'));
        desc7.putBoolean(sTID('strokeStyleScaleLock'), false);
        desc7.putBoolean(sTID('strokeStyleStrokeAdjust'), false);
        var list1 = new ActionList();
        desc7.putList(sTID('strokeStyleLineDashSet'), list1);
        desc7.putEnumerated(sTID('strokeStyleBlendMode'), cTID('BlnM'), cTID('Nrml'));
        desc7.putUnitDouble(sTID('strokeStyleOpacity'), cTID('#Prc'), 100.000000);
        var desc8 = new ActionDescriptor();
        var desc9 = new ActionDescriptor();
        desc9.putDouble(cTID('Rd  '), data.color[0]);
        desc9.putDouble(cTID('Grn '), data.color[1]);
        desc9.putDouble(cTID('Bl  '), data.color[2]);
        desc8.putObject(cTID('Clr '), cTID('RGBC'), desc9);
        desc7.putObject(sTID('strokeStyleContent'), sTID('solidColorLayer'), desc8);
        desc7.putDouble(sTID('strokeStyleResolution'), 72.000000);
        desc3.putObject(sTID('strokeStyle'), sTID('strokeStyle'), desc7);
        desc2.putObject(cTID('Usng'), sTID('contentLayer'), desc3);
        desc2.putInteger(cTID('LyrI'), 2);
        executeAction(cTID('Mk  '), desc2, DialogModes.NO);

        if (data.name != undefined)
        {
            var desc = new ActionDescriptor();
            var ref = new ActionReference();
            ref.putEnumerated(cTID("Lyr "), cTID("Ordn"), cTID("Trgt"));
            desc.putReference(cTID('null'), ref);
            var descName = new ActionDescriptor();
            descName.putString(cTID('Nm  '), data.name);
            desc.putObject(cTID('T   '), cTID('Lyr '), descName);
            executeAction(cTID('setd'), desc, DialogModes.NO);
        }
    } // end of createCircle()

    function linear(X, A, B, C, D)
    {
        var Y = (X - A) / (B - A) * (D - C) + C
        return Y;
    };

    function cTID(s)
    {
        return app.charIDToTypeID(s);
    }

    function sTID(s)
    {
        return app.stringIDToTypeID(s);
    }

}
app.activeDocument.suspendHistory("create circles", "main()");

