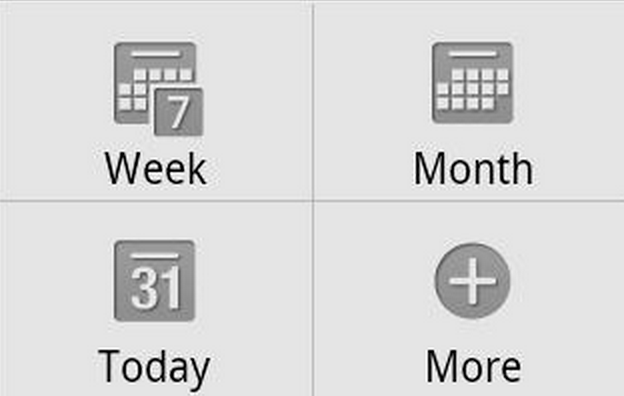
I'm working on a KPI application where basically I need to display the overtime trend of some indicators, for simplicity's sake let's assume the indicator is the number of visitors a web page has over time. I currently display the value and if it is increasing (positive) or decreasing (negative) compared to the previous period. From the same element I need to be able to switch timeframe (day, month or year) and this is where I'm stuck right now. I'd like to use icons for selecting the timeframe and adding a column on my element (something like this https://dribbble.com/shots/1129568-Los-Angeles-CA - see left column) but I can't come up with icons that easily differentiate day, month, and year.
How do you guys suggest me to tackle this issue?
Thanks

