0

I made an svg graph using R (ggplot2) and it displays fine in Firefox.

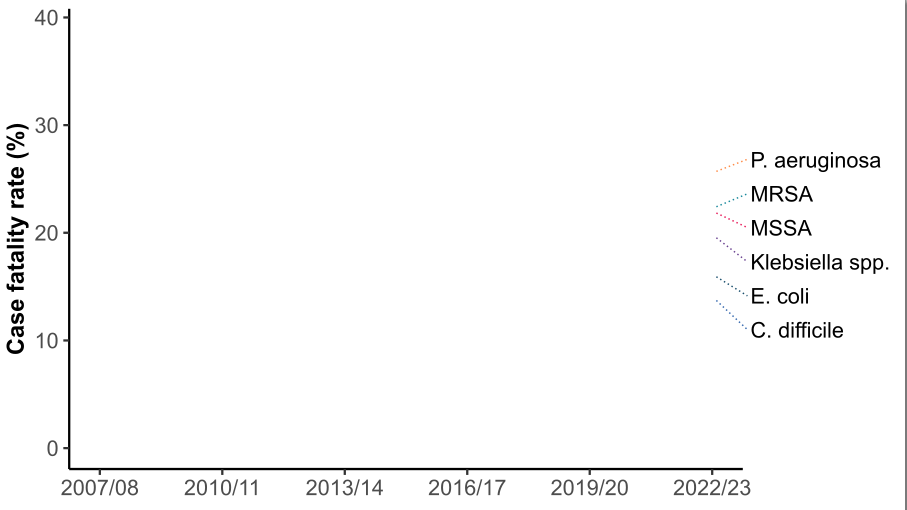
I then edited it in Inkscape to improve the legend. In order to do this, I had to ungroup a group that contained both the legend and the axis lines. This is what the graph looks like in Inkscape (data removed for confidentiality)

enter image description here

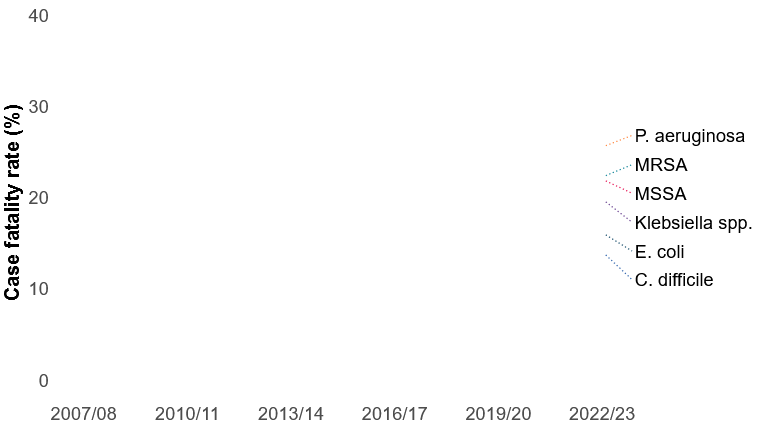
However, when I save the file and open it with Firefox, Edge or Word, the axis lines and the axis ticks are not displayed:

enter image description here

If I open the file again in Inkscape, the axes and axis ticks are still there.

If it helps, the axes and the axis ticks are polylines. I've tried regrouping them before saving the svg, but that didn't help.

What could it be and how do I fix it?

1
  • Hi. This is quite hard to answer without access to the SVG file. But my guess is that it's because Inkscape doesn't support polylines fully. It will display them, but when you save it again, that's when it's probably messing up. A workaround would be to recreate them with Inkscape's own drawing tools instead (the Pen tool), and replace the original lines with the new ones. A bit of a pain, but it should only take a minute or two.
    – Billy Kerr
    Commented Oct 13, 2023 at 19:07

1 Answer 1

0

My guess: There's something that Inkscape reads right but writes wrong. To clear the problem convert the problematic elements to paths. Use Path -> Object to path and Path -> Stroke to path. Try at first Object to path.

Check the structure in the Objects panel to access the parts which need conversion. There can be a mess of nested groups which look impenetrable if it's made in another program. The same happens often when one imports PDF files. Inkscape has a brute force extension Arrange -> Deep Ungroup to clear the jungle if needed.

Your Answer

By clicking “Post Your Answer”, you agree to our terms of service and acknowledge you have read our privacy policy.

Not the answer you're looking for? Browse other questions tagged or ask your own question.