I made an svg graph using R (ggplot2) and it displays fine in Firefox.
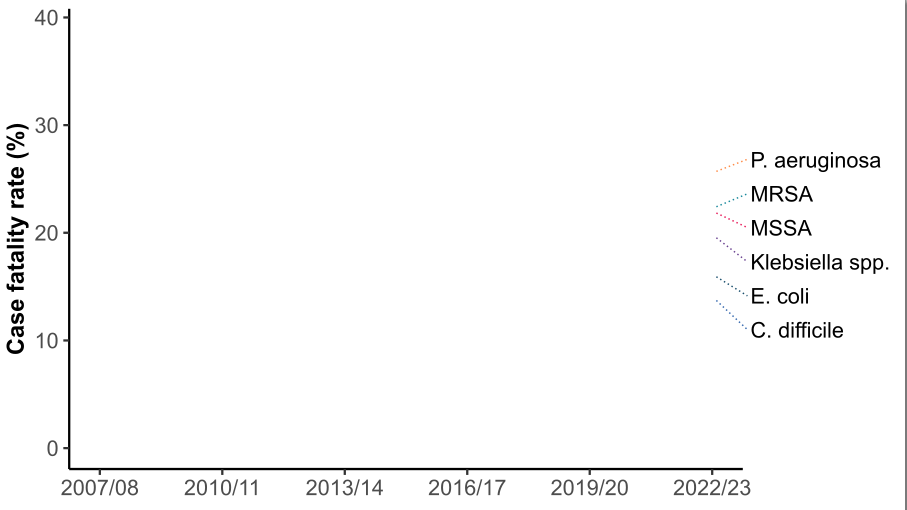
I then edited it in Inkscape to improve the legend. In order to do this, I had to ungroup a group that contained both the legend and the axis lines. This is what the graph looks like in Inkscape (data removed for confidentiality)
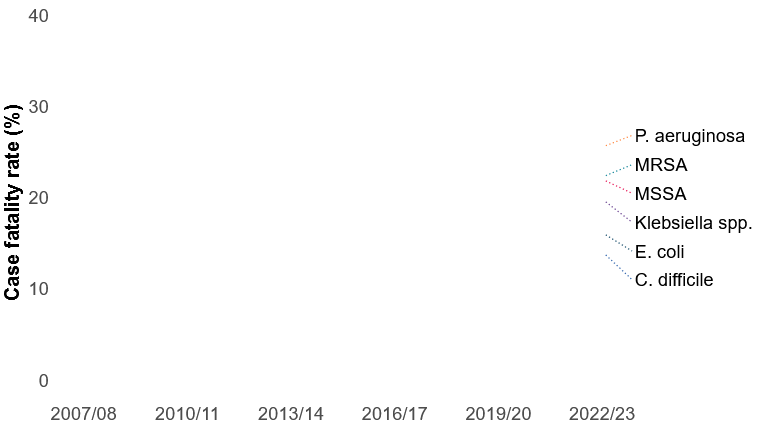
However, when I save the file and open it with Firefox, Edge or Word, the axis lines and the axis ticks are not displayed:
If I open the file again in Inkscape, the axes and axis ticks are still there.
If it helps, the axes and the axis ticks are polylines. I've tried regrouping them before saving the svg, but that didn't help.
What could it be and how do I fix it?


