I would like to visualise sparse 3D points against a black background. Each point is associated with a brightness value. I would like a colour map to display these points in a visually appealing way, such that:
- it is obvious that the colour corresponds to brightness
- points with a low brightness value remain visible against a black background
- bright points are easily distinguishable from dark points, even for the colourblind
- the above remain true even when compressed with JPEG or h264 compression (e.g. when making a YouTube video)
I am well aware of famous colour maps such as Viridis, Parula, Cubehelix, Magma, etc. However, these are not designed for plotting sparse points against a black background, so the darker points are far too dark and cannot be easily seen.
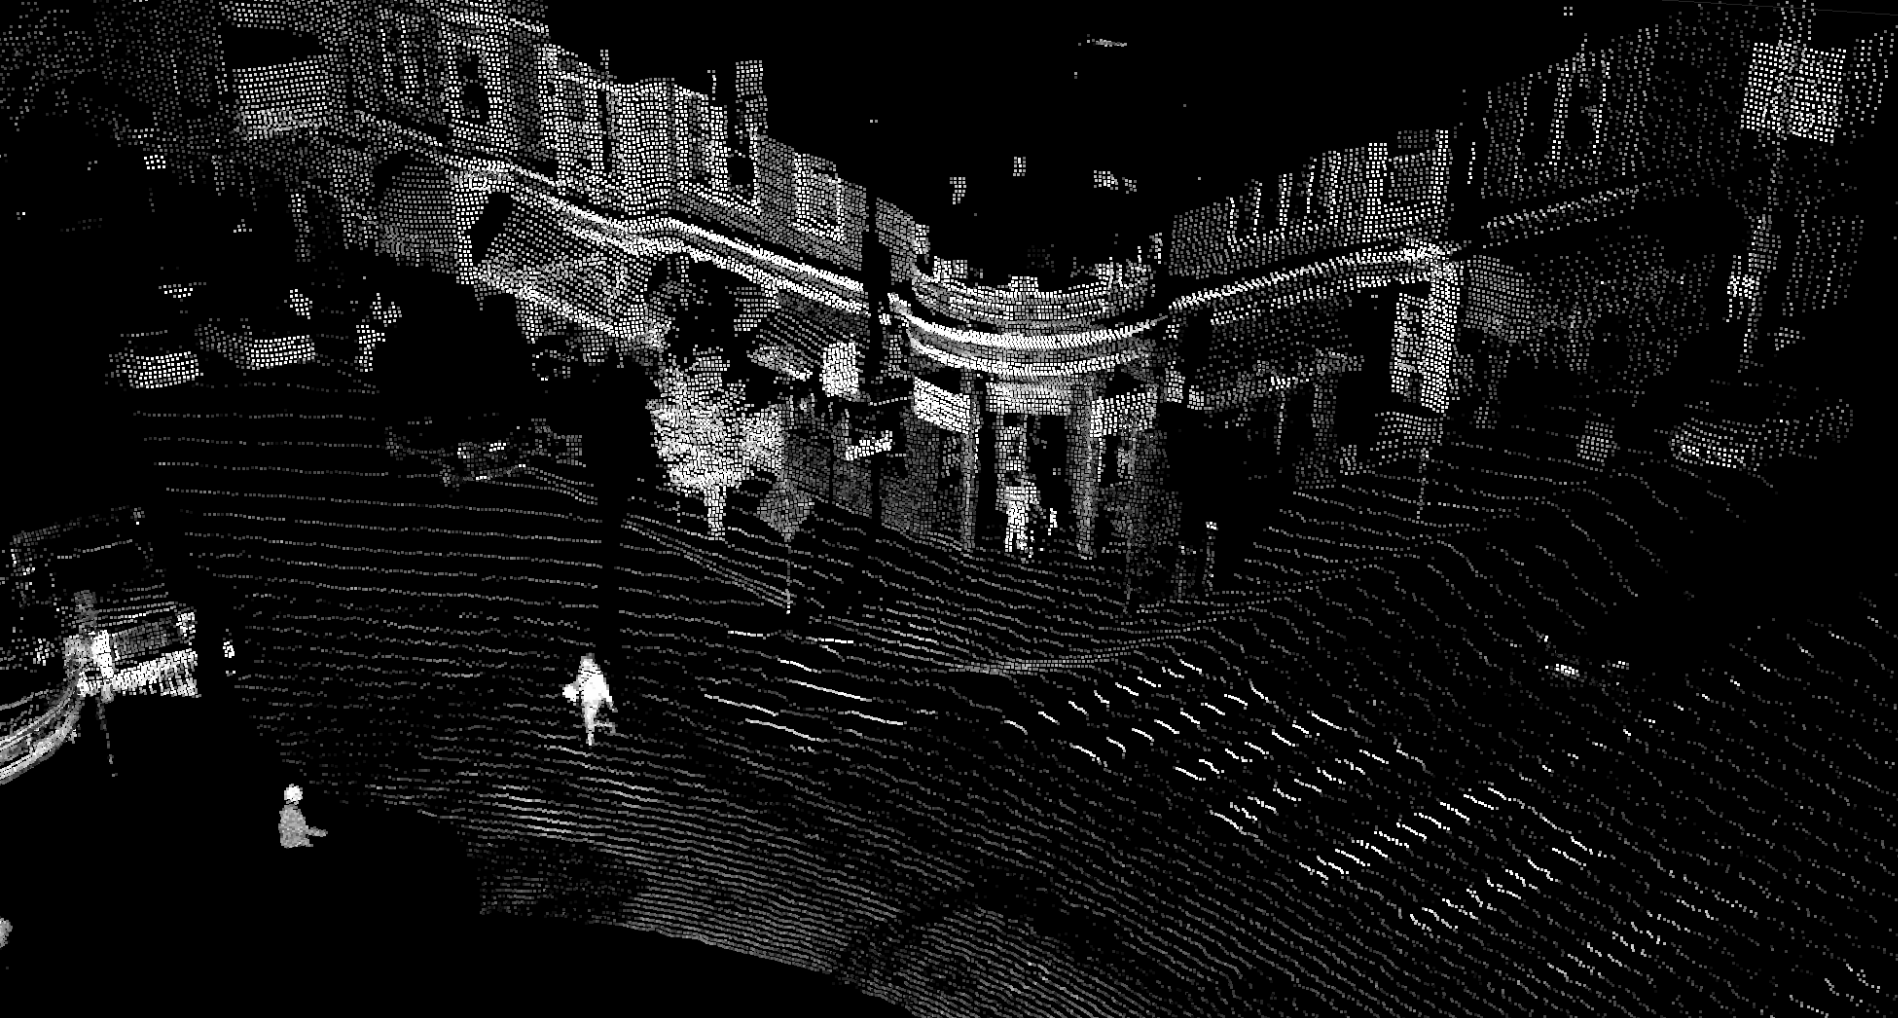
This is the basic black and white raw image:
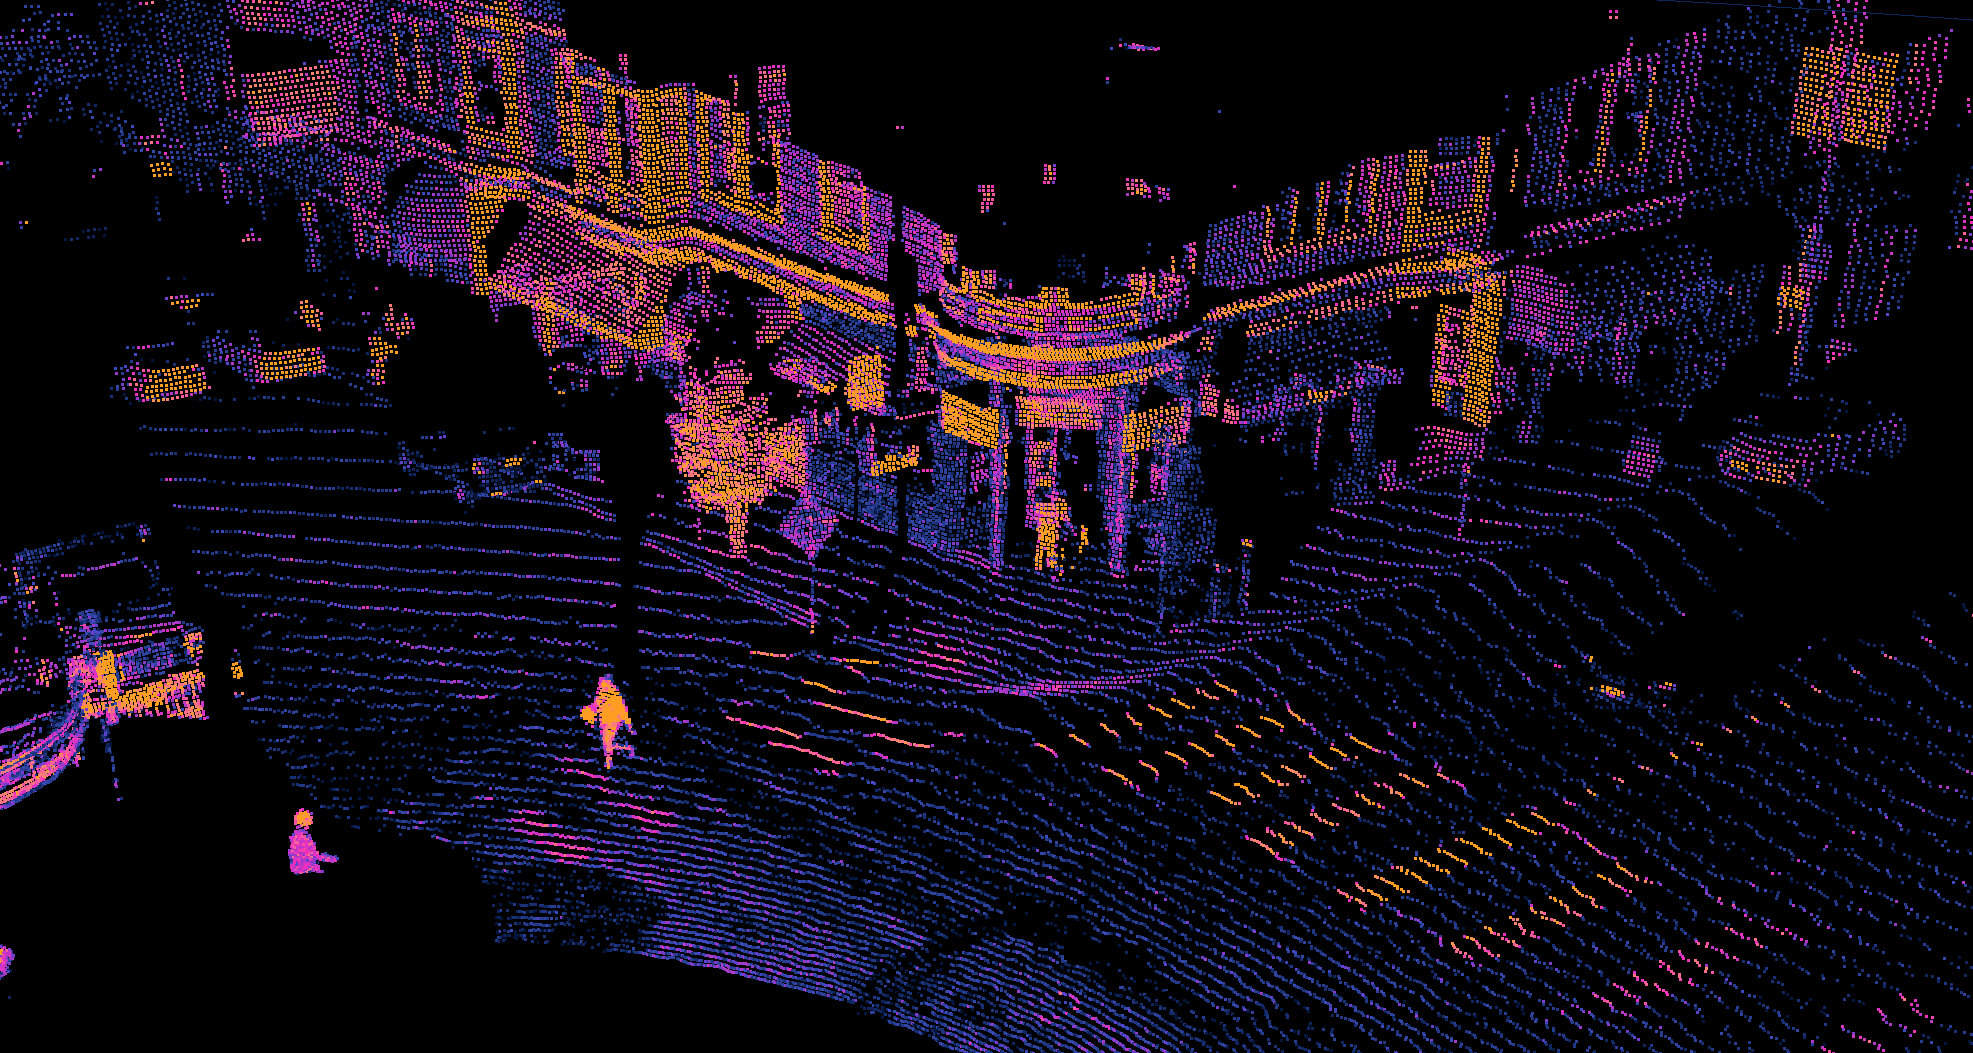
This is the current colourmap I'm using:
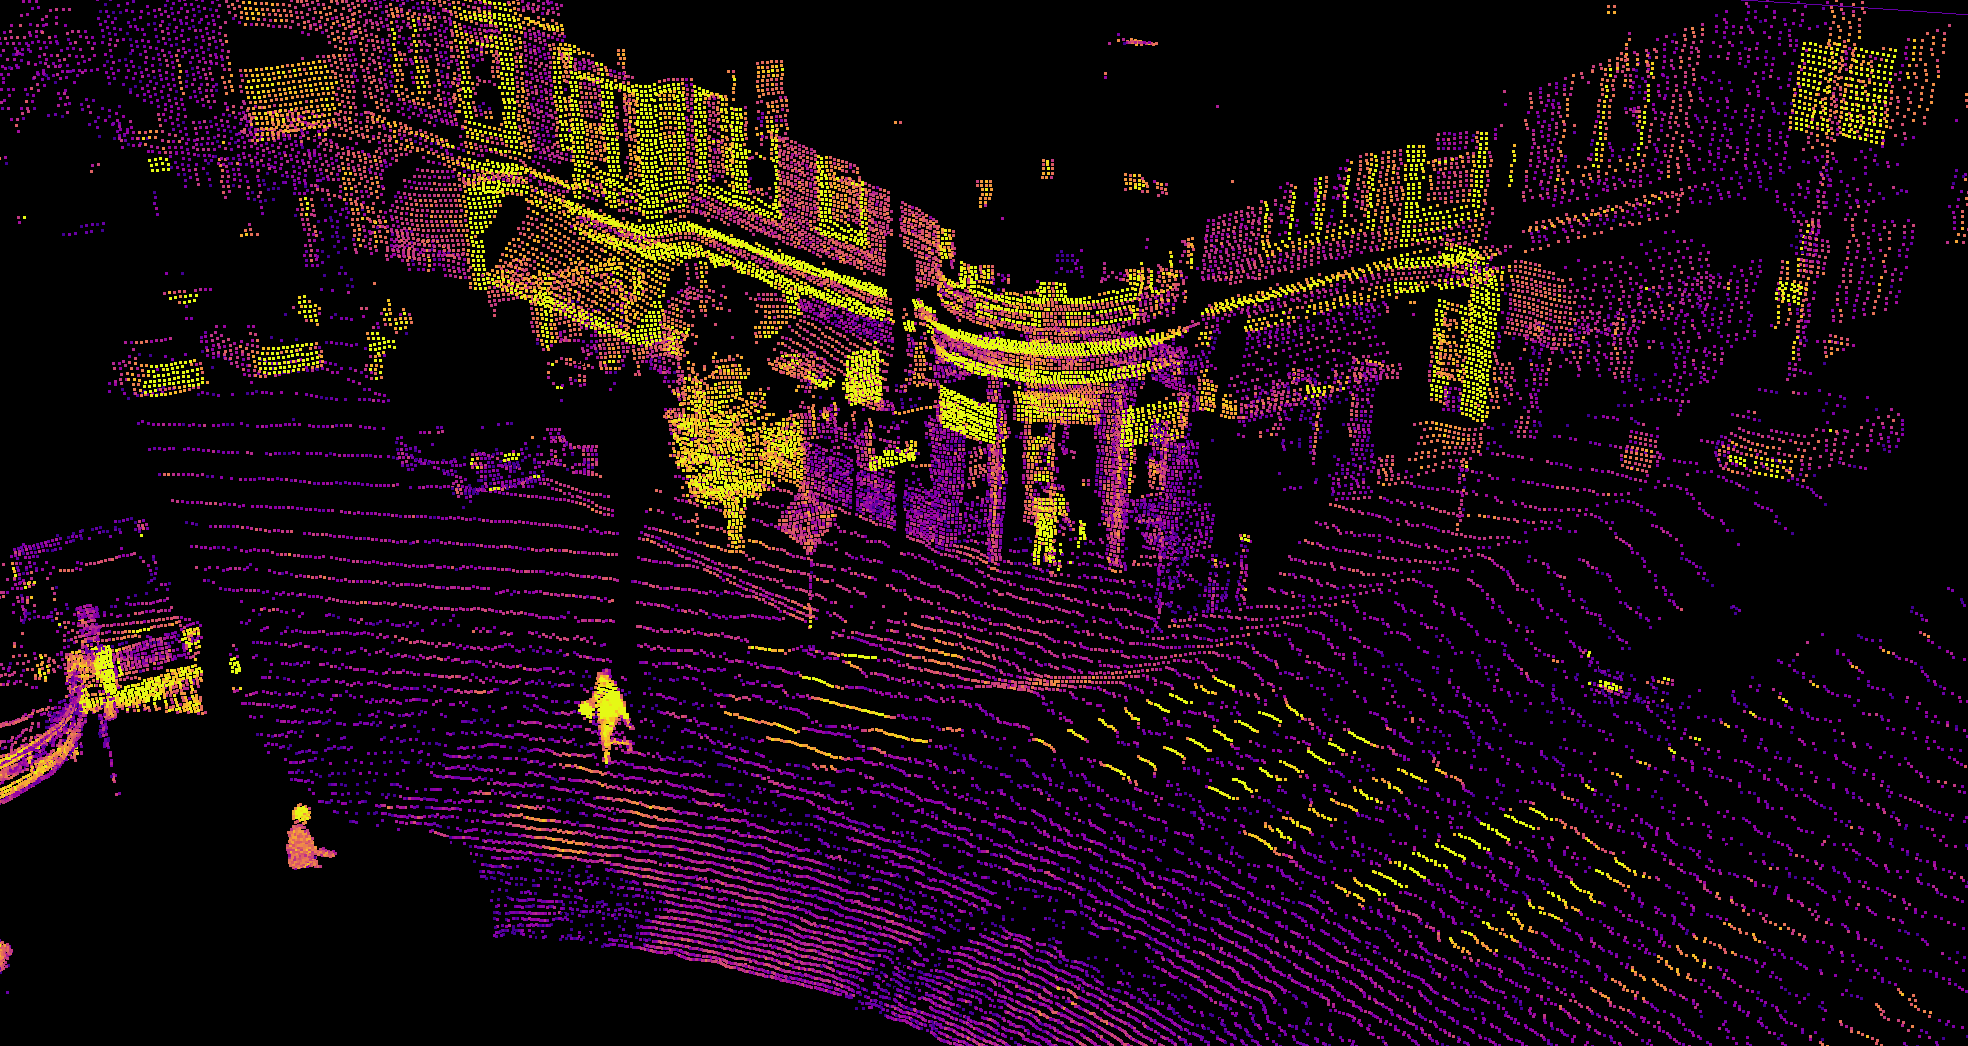
This is the "Plasma" colourmap from matplotlib:
I have developed a tool to assist with picking colours using the HSLuv library
Apparently, for my colourmap, the dark blue points are too hard to see against the black background. Furthermore, with YouTube's video compression, the blue points often disappear altogether.
It looks good for dense point clouds but not for sparse ones.

I would like some ideas to make the dark points more visible against the black background in the sparse point cloud while still satisfying all 4 constraints mentioned earlier.


