I make cross stitch designs, lately been using Affinity Photo/Designer. So I can figure out how much of each colour thread I need, I want to count the number of each pixels of each colour (in the flattened end picture) but I can't find any way, in Affinity or anything else I've tried, but I'm happy to try anything which doesn't cost money (or which I might already have, so just don't suggest anything made by Adobe). Can anyone help me out?
-
3Pretty sure it's possible to do this with Python code. You'd just load the picture as an array of values (with each set of values corresponding to one pixel), then iterate across it counting the number of pixels with values within each color you're interested in. It's not something I've really done myself, though, so I don't know the exact functions you'd need to call for that.– nick012000Commented Sep 17, 2021 at 10:04
-
It's possible in any language where you can do image processing– Zach SaucierCommented Sep 17, 2021 at 16:17
-
2I hesitate to recommend anything from CodeGolf be used in real code, but it may be useful here since it offers solutions to this exact problem in multiple programming languages. codegolf.stackexchange.com/q/81256/38183– Engineer ToastCommented Sep 17, 2021 at 18:53
-
1@EngineerToast what could possibly go wrong? I mean you have regression test, documentation an know how to contact the author. Thats better than most code out there.– joojaaCommented Sep 18, 2021 at 7:07
-
@EngineerToast the Python 2 (0 votes) answer is all but ungolfed, so shouldn't trouble anyone who can work with Python– Chris HCommented Sep 21, 2021 at 9:30
5 Answers
You could do it with GIMP which is free, open source, and works on Mac, Windows, and Linux.
Open an image in GIMP, using File > Open
In the main menu click Windows > Dockable Dialogs > Histogram
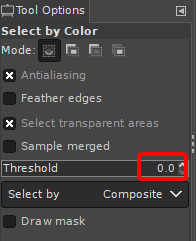
Choose the Select by Color tool Shift+O, and set the Threshold to 0, in the Tool Options, under the Toolbox
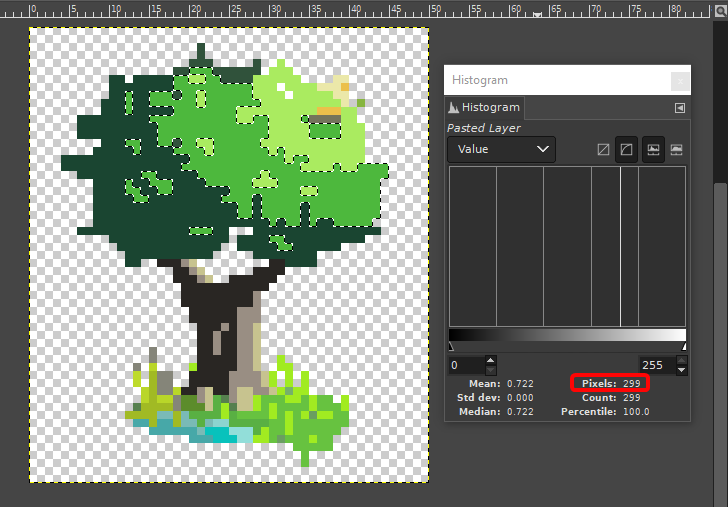
- Click on a colour to select it, and the number of pixels will show in the Histogram. Repeat for other colours
Note: If your image is very small, you might want to zoom in. Use + and - to zoom in/out. Holding down Space while you move the mouse allows panning around the image. Also note that the grey and white checkerboard in the above example is to show the transparent background. If your image has a solid background you won't see these.
-
1For info there’s a near identical solution in Affinity Photo: enable the histogram (View > Studio > Histogram) then select the required colour (Select > Select Sampled Colour…).– pbasdfCommented Sep 17, 2021 at 19:07
-
1
-
2The answer's so similar to yours it feels like plagiarism. But if you're OK with it, I'll post.– pbasdfCommented Sep 17, 2021 at 21:10
-
-
1
Drawing heavily on Billy Kerr's answer using Gimp, this is how you can achieve the same in Affinity Photo:
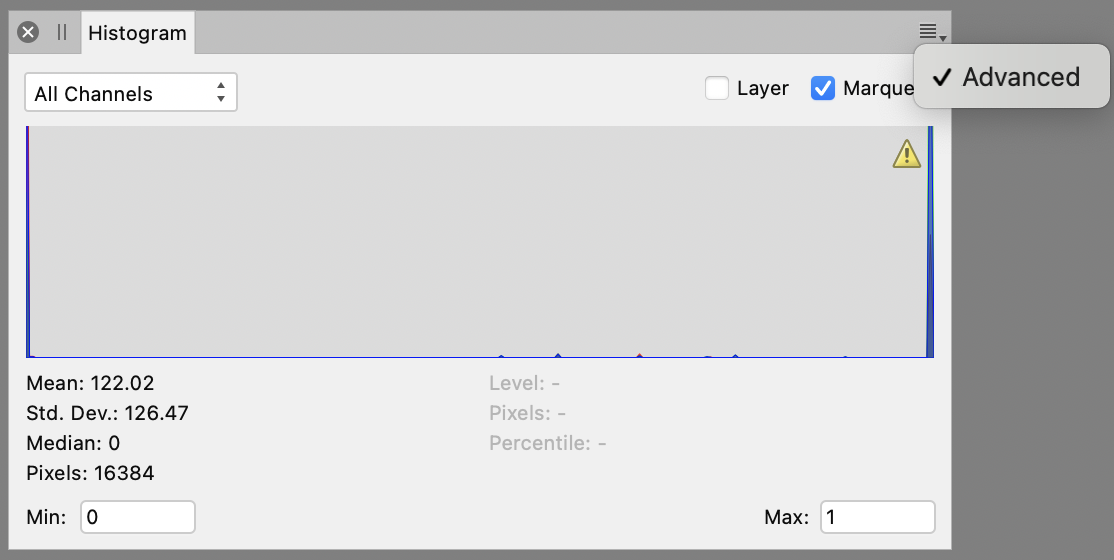
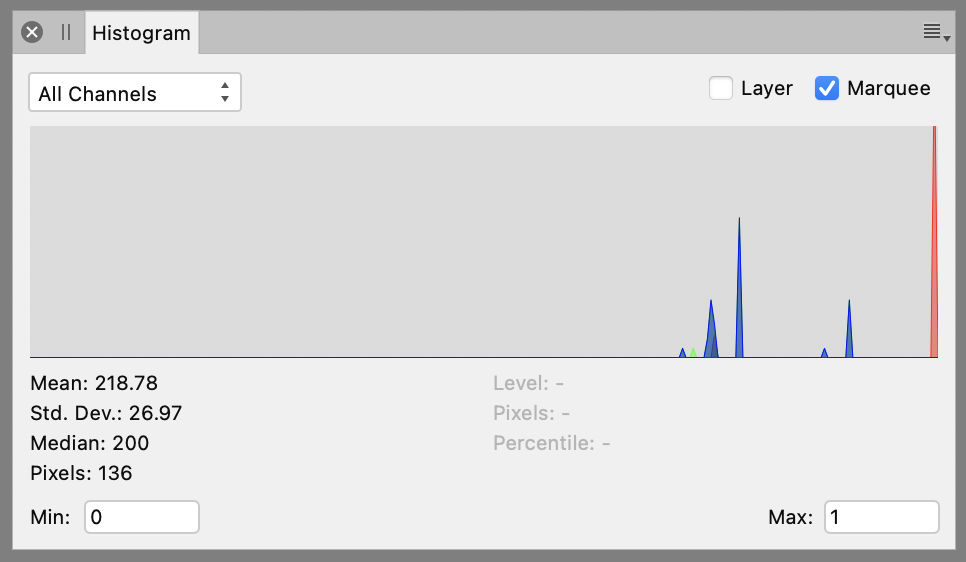
First ensure you have the histogram panel active and visible using the View > Studio > Histogram menu option. (You might need to set the Advanced option for the panel, using the small burger menu top right, in order to view the statistics associated with the histogram.) Ensure that the "Marquee" option is selected, to limit the scope to selected pixels.
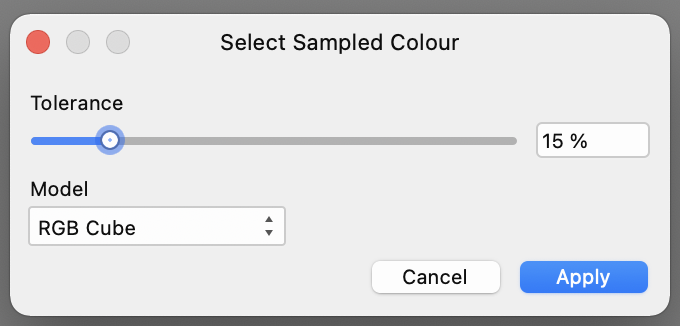
Then use the Select > Select Sampled Colour... option. A small panel will be shown:
Click in your image to choose the colour to be sampled. There's a Threshold slider to determine how closely each pixel must match to be selected. Adjust the slider to include/exclude the pixels you need. Then click Apply. The histogram and statistics will be updated to reflect the selection:
In my example you can see 136 pixels were selected. If you see a small warning triangle top right of the histogram (as in my first example), click it to force a full refresh of the data.
Repeat for the other colours. It's slightly tiresome because you will need to use the Select > Select Sampled Colour... menu option each time.
If you have the command-line tool imagemagick installed, you can use the following command in *nix or OSX terminal:
convert <filename> txt:- | cut -d " " -f 4 | uniq -c
replacing <filename> with the name of your file. This will print a list of counts and hex colors, like:
   10 #4A413F
   14 #483E3C
This works by using the convert tool to convert the file to "txt" format, which is made up of lines like:
9,0: (75,74,76) #4B4A4C srgb(75,74,76)
Which is the x, y coords, then the decimal RGB values, the hex value, and then the srgb value of the pixel. Obviously, this format is not very efficient :). We write this to standard out (txt:- means "write txt format to stdout").
Then, we use the built-in cut command to grab the fourth (-f 4) column, delimited on spaces (-d " "), which here is the hex value (interestingly, there are two spaces between the decimal RGB and the hex value, so if you want the decimal RGB, use -f 2).
Finally, we use the built-in uniq command to count -c the unique lines, and print it to standard out (the terminal).
-
This is nice because you actually get a list in one go. For Windows users there's Cygwin or WSL to provide
cutanduniq(there may be direct equivalents, or write a script that uses imagemagick for the image processing). Imagemagick is available for Windows too.– Chris HCommented Sep 21, 2021 at 9:28
I couldn't find a way to do this in Photoshop, but there is a workaround to do it with Illustrator:
- Copy-paste your image in Illustrator*;
- Use Object > Create Object Mosaic** with the image's exact resolution to convert it into separate squares;
- Use the Selection Tool [V] and double-click on the object to enter the resulting group;
- Select the Magic Wand Tool [Y] and double-click the tool's icon to access its settings;
- Tick 'Fill Colour', set its Tolerance to 1 and untick the other options;
- Open Window > Document Info and open its options to tick 'Objects'
- Click on a coloured 'pixel' with the Magic Wand to select all of them and have the total amount displayed at the top of the Document Info palette.
* I tried placing a .png with transparency, and Ai refused to Mosaic it, hence my advice to just copy-paste.
** This Question has an overview of this technique.
-
1The OP said "don't suggest anything made by Adobe". LOL Commented Sep 17, 2021 at 20:36
-
1@BillyKerr still, the question and its answers on SE are also for other future readers, not only the OP~ Commented Sep 18, 2021 at 5:11
-
-
In my initial search for a solution to this problem I came across this web tool: https://townsean.github.io/canvas-pixel-color-counter/
I had the additional complication that my image had many (thousands) of shades that were slightly different than the main colors I wanted to identify. Per the comments on the question, I wrote a script in Python to perform this counting.
https://gist.github.com/mirrorcoloured/fb448599d1653c48ec8754bae7cceaae
It has two functions, print_color_summary which counts all unique colors in the image (similar to the linked tool at the top). I also made print_color_summary_with_mapping which takes in a list of colors and matches every pixel to the closest color in that list.
Example:
The first function lists 25,899 unique colors over 73,920 pixels.
The second function, given a list of base colors like this (arbitrarily chosen by me):
{
    (0, 0, 0): "black",
    (140, 140, 140): "gray",
    (255, 255, 255): "white",
    (92, 210, 70): "skin green",
    (244, 71, 54): "spine red",
    (255, 130, 78): "shoe orange",
    (250, 234, 37): "shoe yellow",
},
gives:
black       32215   43%
gray        5418    7%
white       4980    6%
skin green  22503   30%
spine red   1804    2%
shoe orange 5336    7%
shoe yellow 1664    2%
Note that in this example the background is actually transparent which is being grouped under 'black'. The code includes checking for 4-channel rgba so you may match to transparency if desired.

