The Histogram dialog is your friend.
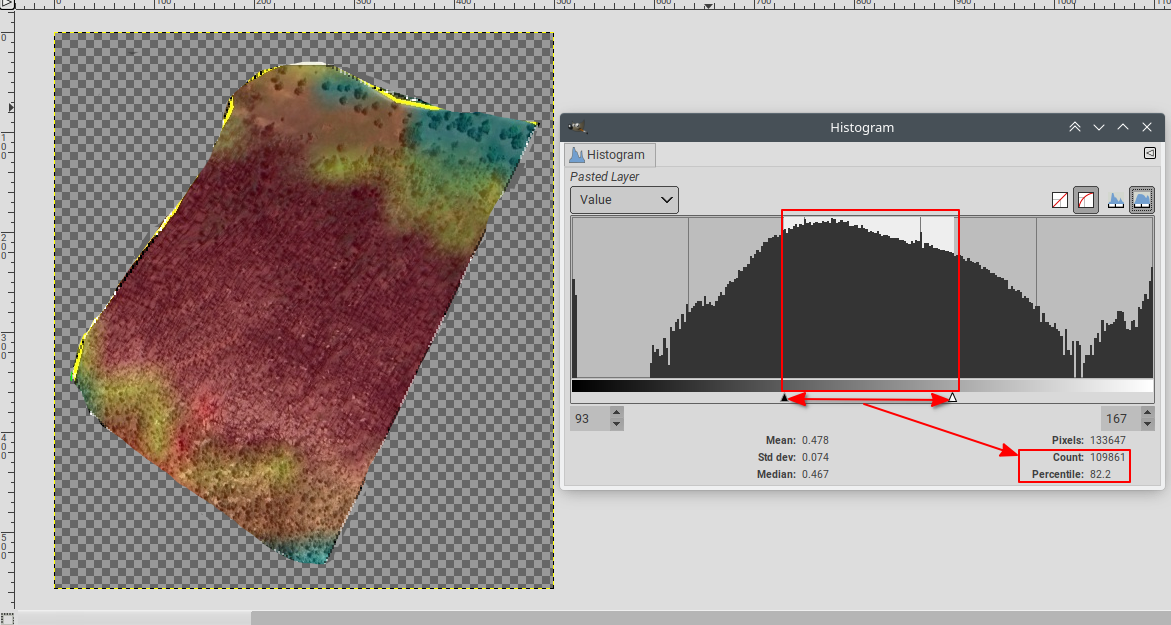
When used "raw", if shows an alpha-weighted count of the pixels (in other words, it counts non-transparent pixels). For instance in this image:

Pixels is the count of opaque pixels (the image is 300K pixels)Count and Percentile are the count and percentage of the pixels that are in the range defined by the two small handles under the graph. Shown here for completeness but I don't think you can make much use of this.
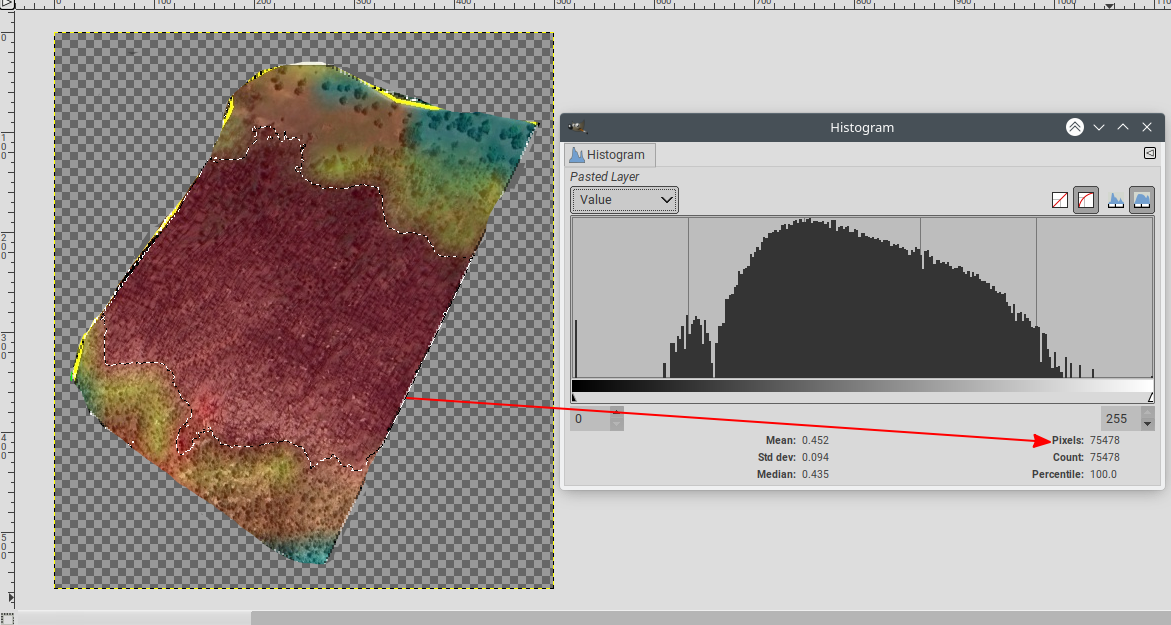
If there is a selection on the image, the same dialog restricts itself to the pixels in the selection, so Pixels becomes the count of selected pixels.
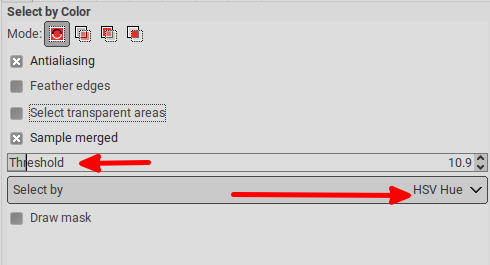
In your case this can be used with the "By color select" tool, and make the tool select pixels that have a similar hue (HSV Hue or LCH Hue), using the threshold to adjust the hue tolerance :

And the histogram will show you the count of pixels in the selection:

So 75478 / 133647 = 56.48%
Remarks:
- You can keep the Histogram dialog "up", and it will auto-update if you change the selection (it also "follows" the active image).
- You can use any selection tool. The "Freehand select"/"lasso" can for instance be more suitable to select a specific area
- You can combine selections (add subtract, intersect). And these selections do not need to be done with the same tool.
- You can save a selection to a channel, and then restore it later, or combine it with another selection (these channels are saved with the image if you save as XCF).
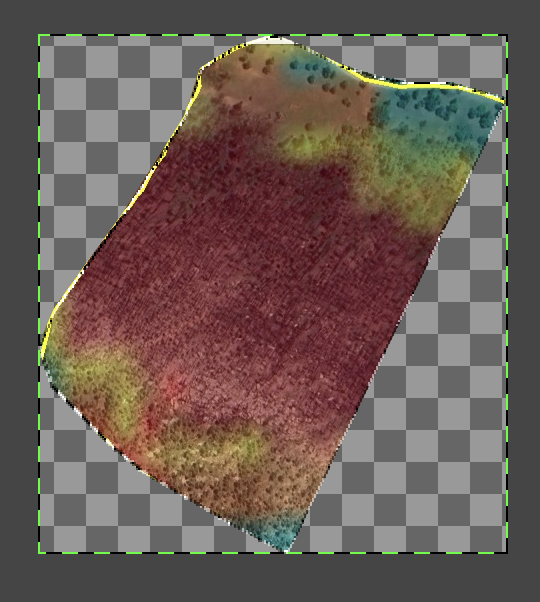
 Trying to count colored pixels using GIMP and following the instructions here:


