1

I would like to replicate this graph for the allocation of radio band frequencies using a different set of data but a similar style. I would like to avoid making it from scratch and I was looking for some software that could help me make one, but I don't even know how to describe such a type of graph

https://en.wikipedia.org/wiki/Very_high_frequency#/media/File:VHF_Usage.svg (it doesn't let me add the image directly, maybe it cannot show SVGs?)

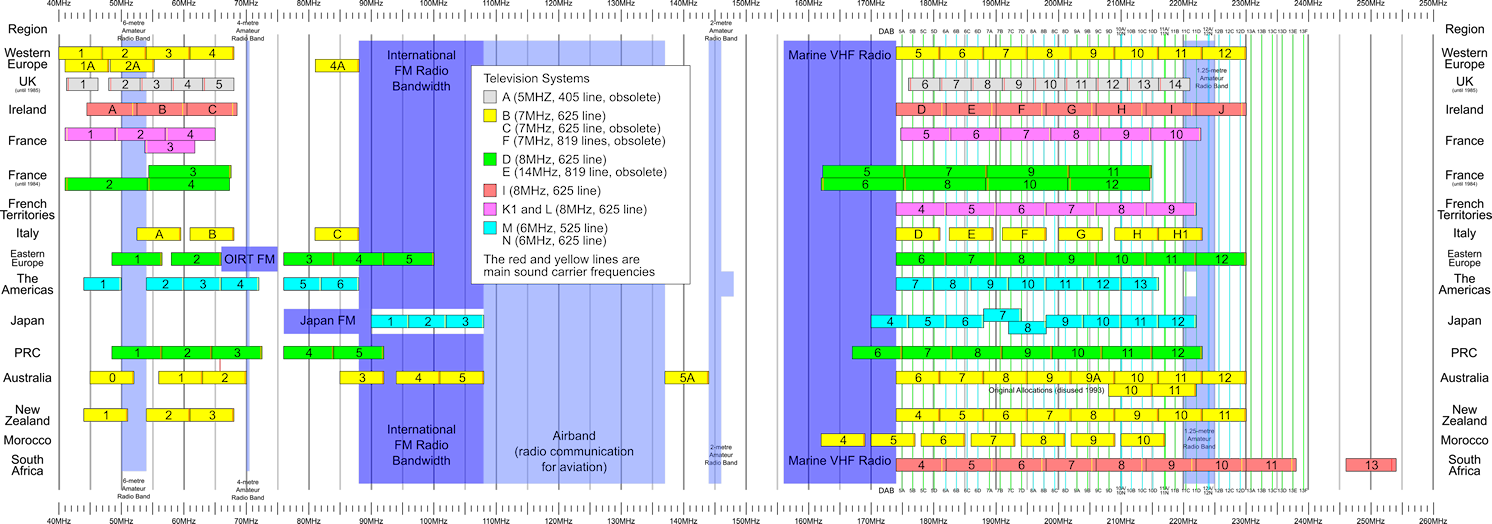
vhf_usage image

1
  • added image for convenience, link remains for attribution
    – fred_dot_u
    Commented Jan 8, 2021 at 21:59

2 Answers 2

1

It's kind of a Gantt chart

You can make it using a grid and/or table in InDesign or Illustrator.

1
  • Gantt chart (named by its inventor) was created about 100 years ago to present dependencies between tasks. It's a project management tool. It was and still is a way to visualize complex projects. The same invention was made in several countries, but Gantt's work became famous when it was used to manage U.S. operations in WW1.
    – user82991
    Commented Jan 9, 2021 at 19:06
1

I'd call that a bar chart.

The SVG was made in Inkscape. It says so in the XML

<!-- Created with Inkscape (http://www.inkscape.org/) -->

And since it's already an Inkscape SVG, you can just open it and edit it in Inkscape, which is a free and Open Source vector image editor.

Your Answer

By clicking “Post Your Answer”, you agree to our terms of service and acknowledge you have read our privacy policy.

Not the answer you're looking for? Browse other questions tagged or ask your own question.