2

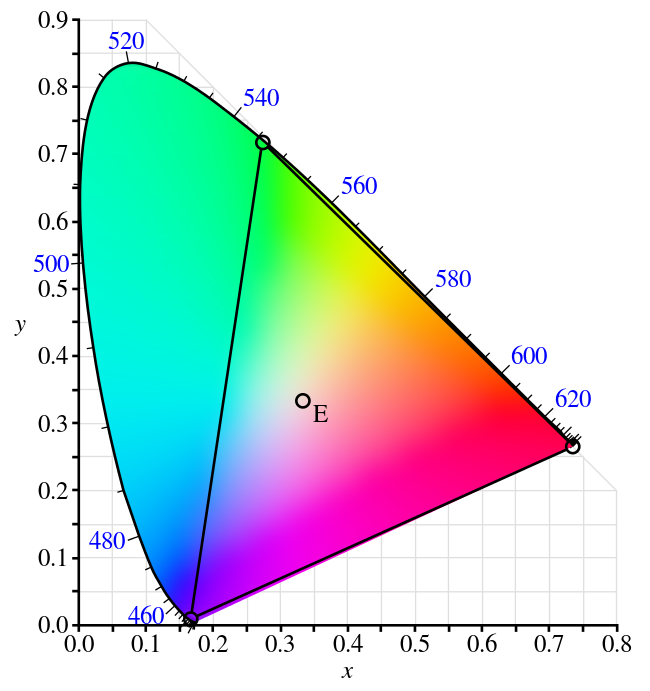
Modern monitors use RGB to reproduce colors. The [RGB colorspace, however, is not the full range of colors, and only occupies a triangle in the "full" chromaticity diagram][1]. What colors are monitors showing outside of that triangle then?

[1]: https://en.wikipedia.org/wiki/CIE_1931_color_space#CIE_RGB_color_spaceenter image description here

2 Answers 2

4

It is impossible for the monitor to show things outside your color range. So you either show the closest color in your range or something else.

If you draw a graph then the colors you draw on the graph can be scaled to your space. You still dont see those colors on the monitor offcourse, that would be impossible. So the colors you see in the graph represent the idea of the colors, but not the colors themselves.

Now a smart person would think is this is easy to do a monitor that shows them all. Just choose a triangle that is bigger than the entire human visual space. But alas that is not possible. The round outer edge of of the graph represents the limits of physics there is nothing outside it.

PS: Some of the colors at the edge of the crhroma graph are possible to make in ordinary kitchen physics, and are really cool. Unfortunately you can only sustain the reaction for a split second.

4
  • I'm curious about what kitchen physics you're talking about to try for myself! Commented Apr 8, 2018 at 8:21
  • That makes sense, thanks. But I'm still not 100% clear on what's happening in this particular image (added above). So the entire plot contains RGB colors, but the regions it's depicting as 'outside of the RGB space' are just similar to the actual ones? And the region in the triangle is actually a smaller color space (than RGB) expanded to resemble the colors of RGB space? Commented Apr 8, 2018 at 13:35
  • 1
    @DilithiumMatrix The triangle represents the span of RGB the colors are just for design. They dont reflect whats inside the plot in any way. Its bit like assigning red to infrared in a graph. It represents Infrared but obviously isnt since you can not see infrared.
    – joojaa
    Commented Apr 8, 2018 at 16:13
  • 1
    @ZachSaucier if you burn table salt by sprinkling it on a burner you should get this nice orange that is almost entirely one wavelength of color (or at the edge of the chromatography plot)
    – joojaa
    Commented Apr 8, 2018 at 16:16
2

None. What can be making you confuse is that RGB color spaces are defined by three chromaticities of the red, green, and blue additive primaries, and can produce any chromaticity that is the triangle defined by those primary colors. So, given enough color spaces I suppose you can cover the entirety of CIE XYZ. And so different monitors cover different RGB color spaces depending on their fundamental pixels natural chromaticities

There is nothing like "the RGB color space" there exist a bunch of RGB color spaces:

https://en.wikipedia.org/wiki/RGB_color_space

So how I know what are the color that map out of this triangle in a specific monitor?

You must know the native color space of this particular monitor, witch shows all colors that can be seen in this particular monitor, finaly making difference of those 2 spaces (your monitor color space and CIE_1931) you will know what colors your monitor can show that are not in CIE_1931.

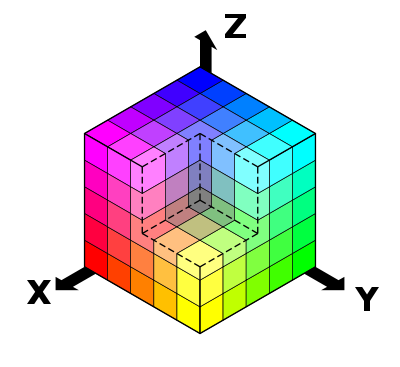
CIE_XYZ, the entire chromaticity diagram are just visual conceptions, the colors help understand toward what direction the maximum chromaticity colors for red, gren or blue go, they are not real, like a map is not showing really the country itself or the planet that is a sphere. A color space for example is tridimensional.

Also be aware that color spaces are mathematical entities, they don't exist in real world and honestly monitors don't really cover them absolutely, as they are uncountable set. This generate many other problems like precision, absolute black and absolute white, etc...
enter image description here

Just as an addendum, as pointed by joolaa, the chromaticity diagram is an intensity slice, if it was not clear CIE_XYZ is not a RGB color space,it is a tristimulus color space, z in this case represents color luminance, and here we can enter in more one subject that are color models that limited by precise definitions form a color space, there exist many forms to represent colors with math (HSV, HSL, HSY', RGB, etc...) it is not limited to 3 values also (CMYK, etc).
6
  • Thanks for the answer. What you're saying makes sense, but doesn't answer what is being plotted in images like the given example. Commented Apr 8, 2018 at 13:37
  • Each monitor has sub-pixels with substances and characteristics that defines where the 3 pointos of this triangle for the specific monitor are. This is the problem, We can't be sure, depends on the specific model native color space, what we can say is how well they map, knowing its native color space, to known popular RGB color spaces Commented Apr 8, 2018 at 13:48
  • Sure. But I don't think it matters where exactly the triangle is (or what exact colors it includes), I'm just confused about the fact that the entire area here is larger than the triangle, but still the monitor (any monitor) is drawing colors in it. Commented Apr 8, 2018 at 14:05
  • this is a hypothetical image to help in understanding, honestly the TRUE color space is 3D don't you see? x y z, RGB... Commented Apr 8, 2018 at 14:06
  • 1
    The color plot is a slice of one intensity
    – joojaa
    Commented Apr 8, 2018 at 16:21

Your Answer

By clicking “Post Your Answer”, you agree to our terms of service and acknowledge you have read our privacy policy.

Not the answer you're looking for? Browse other questions tagged or ask your own question.