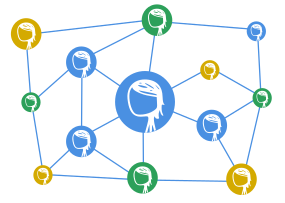
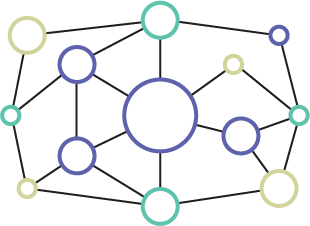
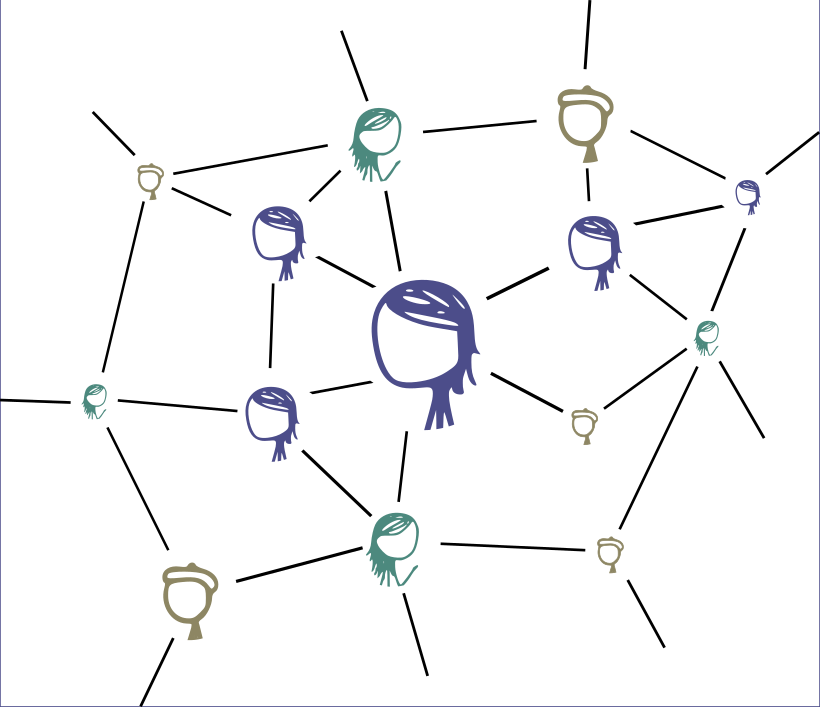
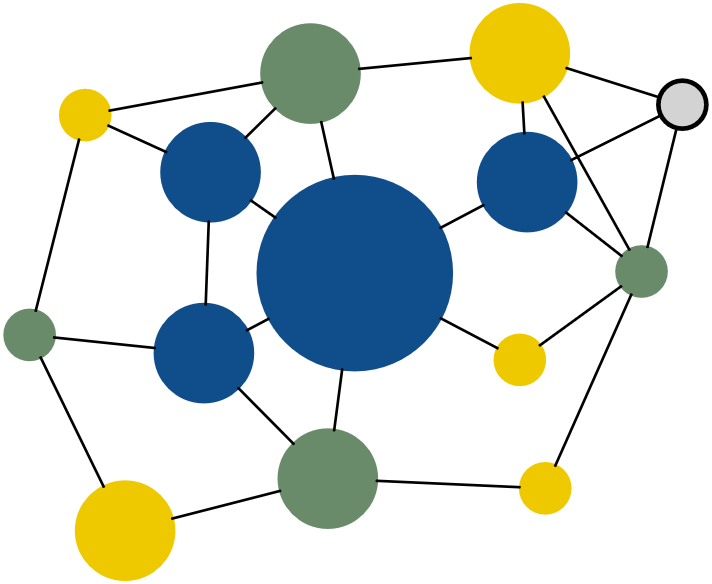
Graph balancing is hard, and any tips that you get for the above graph might not apply anymore if you modify some connections.
There are dedicated tools for this task, e.g. Graphviz.
You could give ids to your nodes: 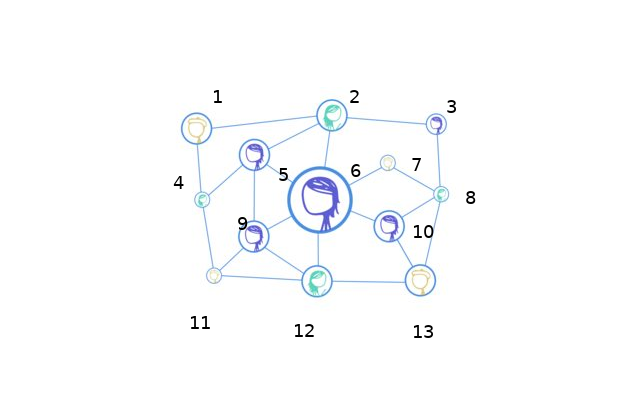
and simply list every connection:
graph G {
    1 -- 2
    1 -- 4
    2 -- 3
    2 -- 5
    2 -- 6
    3 -- 8
    4 -- 5
    4 -- 11
    5 -- 6
    5 -- 9
    6 -- 7
    6 -- 9
    6 -- 10
    6 -- 12
    7 -- 8
    8 -- 10
    8 -- 13
    9 -- 11
    9 -- 12
    10 -- 13
    11 -- 12
    12 -- 13
}
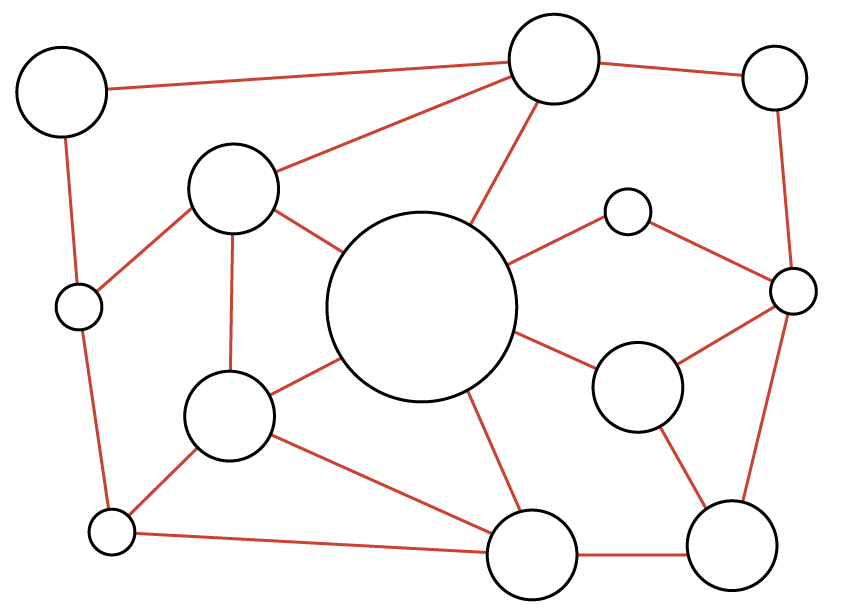
You can also specify the size, the labels and the colors. Note that the positions are not specified anywhere:
graph G {
    // Graph layout
    overlap=scalexy;
    sep="+0.1";

    // Node sizes
    node[shape=circle];
    node[width=1.5];
    6[fontcolor="dodgerblue4"];

    node[width=0.8];
    1;
    2[fontcolor="darkseagreen4"];
    5[fontcolor="dodgerblue4"];
    9[fontcolor="dodgerblue4"];
    10[fontcolor="dodgerblue4"];
    12[fontcolor="darkseagreen4"];
    13

    node[width=0.2];

    // Connections
    1 -- 2
    1 -- 4
    2 -- 3
    2 -- 5
    2 -- 6
    3 -- 8
    4 -- 5
    4 -- 11
    5 -- 6
    5 -- 9
    6 -- 7
    6 -- 9
    6 -- 10
    6 -- 12
    7 -- 8
    8 -- 10
    8 -- 13
    9 -- 11
    9 -- 12
    10 -- 13
    11 -- 12
    12 -- 13

    // Colors
    4[fontcolor="darkseagreen4"];
    8[fontcolor="darkseagreen4"];
    1[fontcolor="gold2"];
    3[fontcolor="gold2"];
    7[fontcolor="gold2"];
    11[fontcolor="gold2"];
    13[fontcolor="gold2"];
}
There are different balancing algorithms. neato gives results that are similar to your example:
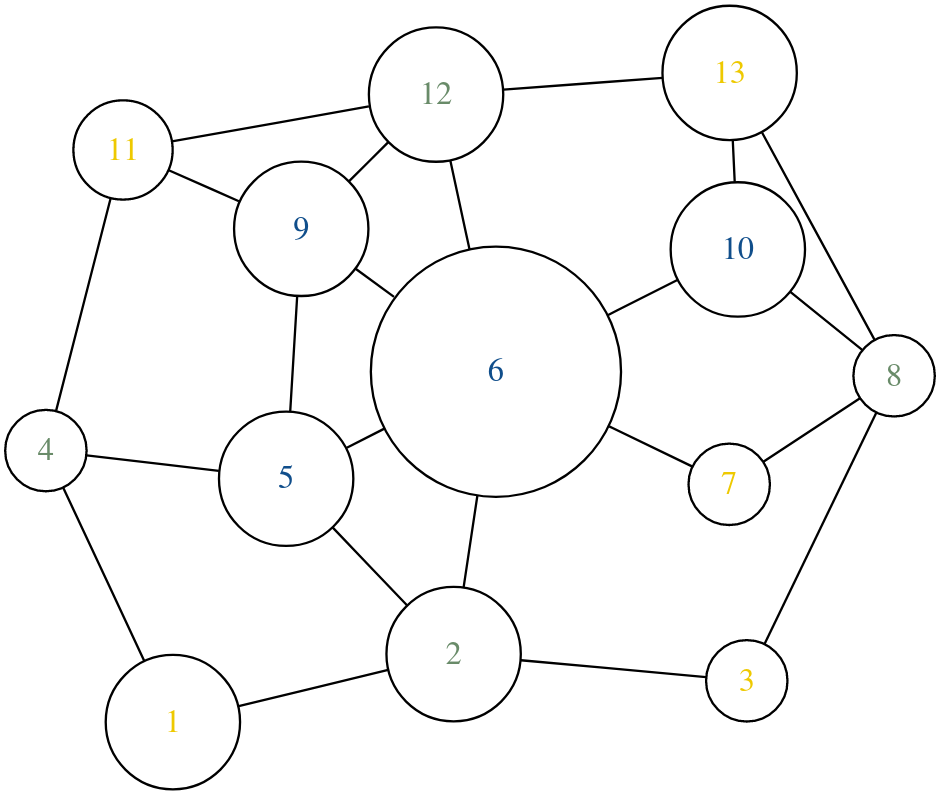
It would also work fine with hundreds of nodes. You can try it with this online-editor, and play with the sizes and connections.
You can also insert images inside nodes and output png or svg files.


